
Local Search: See Who Wins Google Maps, Search, and AI Answers Near You
The Marketing page is now a local-search intelligence tool for facility owners. Your share of the clicks on Google Maps, Google Search, and Google's AI answers for the searches families run nearby, a map of who takes the rest, a Google reviews comparison, a benchmarked Google Business Profile scorecard with plain what-to-do instructions, and a Growth tab that prices the missing clicks in your own revenue. Three-step setup, then weekly Monday snapshots with admin alerts.

Our last update was Chat, two-way messaging with athletes and parents. This one is about the question every owner asks and almost nobody can answer: when a family nearby searches for batting cages, hitting lessons, or a youth camp, who do they find? The Marketing page now answers it, in four tabs: Local Traffic, Reviews, Listing, and Growth.
Pick the local searches that matter to you, confirm your Google listing, choose the competitors you actually compete with, and run the analysis. In one to three minutes you see your share of the clicks on Google Maps, Google Search, and Google's AI answers, who is taking the rest, where those businesses sit on a map, what that traffic is worth in your own revenue, and what to fix first. From then on Baseline re-checks your Maps positions every Monday and alerts your admins on big moves.
Written for owners, not marketers
Local search visibility
How Ridgeline Baseball Academy shows up on Google Maps for the searches people run nearby, who is capturing those searches instead, and where the biggest gaps are.
Search volume area: Franklin, Tennessee, United States
5% of clicks
Leader: Northside Hitting Lab
~38 clicks a month going elsewhere
1% of clicks
Leader: Diamond Drive Training
~148 clicks a month going elsewhere
0% of clicks
Cited in 0 of 6 AI answers · top source: google.com
~32 clicks a month going elsewhere
Across all three places, an estimated ~218 clicks a month from your tracked searches go to other businesses. Pick a place above to see who gets them and how to win them back.
Where the competition is
Every business in the Google Maps top 20 for your tracked searches, sized by the clicks a month it captures. You and your busiest chosen competitors are labelled; hover any dot for details.
What people search for, and where you show up
Monthly Google searches in your area and your listing's position in Google Maps for each. Missing clicks estimate what the #1 result would add each month.
| Search | Searches / month | Your position | #1 on Google Maps | Missing clicks / month |
|---|---|---|---|---|
| batting cages near me | 480 | Not on page 1 | Northside Hitting Lab | +134 |
| baseball training | 20 | #3 | Northside Hitting Lab | +4 |
| hitting lessons | 10 | #5 | Velocity Sports Complex | +2 |
| pitching lessons | 10 | #8 | Northside Hitting Lab | +2 |
| softball training | 10 | Not on page 1 | Diamond Drive Training | +3 |
| youth baseball camps | 10 | #9 | The Cage Co. | +2 |
Click estimates assume about 30% of searchers click a Maps result, weighted heavily toward the top positions. Use them to prioritise, not as exact traffic.
Three steps, once per facility
- Tell us about your facility. Your Google Business listing name, your website, and the local searches to track, for example “batting cages near me” or “baseball lessons Franklin”. Your address on file is the search location, so results reflect what someone near you actually sees. Save, and the analysis runs.
- Confirm your Google listing. Baseline shows the listing it believes is yours, marked Best match. Tap This is us, or Change to pick another from the businesses found.
- Choose your competitors. Every business found in the Maps top 20 for your searches, with the five taking the most clicks pre-selected. Tap to add or remove. These are the businesses the Reviews and Listing tabs compare you with.
Multi-facility accounts get a facility picker at the top of the page. Setup, results, and history are stored per facility.
Local Traffic
Three tiles at the top, one per place people search. Each shows your share of the estimated clicks across your tracked searches, whether you are winning or losing, who the leader is, and how many clicks a month are going elsewhere. The AI answers tile shows whether Google's AI Mode cites you as a source, and in how many of your searches. Tap a tile and the whole tab switches to that place.
- Where the competition is. Every business in the Maps top 20 plotted at its real location. Bigger dot, more clicks a month. Blue with a white ring is you, gold is the competitors you chose, muted purple is everyone else. Hover any dot for rating, review count, clicks, best position, and top searches.
- What this means for you. A short card that names the searches you do not appear in and the ones you already lead.
- Who captures local searches. The top businesses by click share, for the competitors you chose or everyone found, with a jump straight to their reviews.
- What people search for, and where you show up. One row per search: searches a month, your position, the #1 result, and the clicks you are missing.
- Track my position over time. Your Maps position each Monday for every tracked search. Admins are notified when you drop three or more places, fall out of the top 20, or reach #1.
Reviews
Your Google rating, total reviews, new reviews in the last 90 days, and how many are still awaiting your reply, next to the same numbers for your chosen competitors. When low ratings are waiting, the page says so: reply to those first.
The chart underneath, Who is earning reviews right now, plots new reviews per month over the last year for you and the three competitors earning them fastest. A steady flow of recent reviews is what holds a Maps position, and this is where you see whether you have one. Your latest reviews follow, newest first, each with a Replied or No reply flag and a link to reply on Google. If you already use automated review requests, this is where you watch them pay off.
Google Business Profile health
Exactly where Ridgeline Baseball Academy's Google listing stands: what is set up well, what needs work, and how it compares with your competitors' listings. A complete, active profile is the biggest lever for Google Maps positions.
Compared with your 3 competitors
Listing health
8 checks set up well · 3 need work · 2 missing. Start with the missing ones.
Scorecard for “Ridgeline Baseball Academy”
Foundation
Listing is claimed and verified
Your listing is claimed. 3 of 3 competitors have claimed theirs.
Primary category
Yours: Baseball club. Most common among competitors: Baseball.
Worth checking: your competitors mostly use “Baseball”. If that is what customers search for, consider it as your primary category and keep yours as an additional one.
Additional categories
You list 2 additional categories: Baseball goods store, Sports club. 1 of 3 competitors list two or more.
Website link
Links to your website. 3 of 3 competitors link a website.
Opening hours
Hours are set for 6 of 7 days (currently closed). 2 of 3 competitors show hours for every day.
What to do: enter hours for every day (mark days you are closed as closed rather than leaving them blank) and keep holiday hours current. Google shows “Open now” only when hours are set.
Book online button
No booking link on the listing. 0 of 3 competitors have one, so their searchers can book without leaving Maps.
What to do: in your Business Profile add a booking link (under Bookings / Appointment links) that points to your booking page, so “Book online” appears on the listing.
Trust
Star rating
You: 4.8★ (67 five-star, 1 four-star, 3 three-star or lower). Competitor average: 4.9★.
Number of reviews
You: 71. Competitor average: 412. The most-reviewed competitor has 907.
Listing
A scorecard for your Google Business Profile, benchmarked against your competitors' listings, rolled up into one listing health score: Strong, Good, or Needs work. The checks are grouped as Foundation (claimed and verified, primary and additional categories, website link, phone number, opening hours, book online button), Trust (star rating, number of reviews), and Content & activity (a 250 to 750 character description, 20 or more photos, attributes, and two or more Google posts a month).
Every item that needs work ends with a What to do written for a non-technical owner. For a missing booking link: “in your Business Profile add a booking link (under Bookings / Appointment links) that points to your booking page, so ‘Book online’ appears on the listing.” Start with the missing ones; a complete, active profile is the biggest lever for Maps positions.
Growth
The same picture in money. Baseline takes your net revenue over the last 12 months divided by your distinct paying customers, from your own payment data, and converts clicks into customers and revenue on three rungs:
- Today. What your current clicks from the tracked searches turn into over a year.
- Next level. What matching the current leader's share would add.
- Ceiling. The full opportunity if you were #1 in every tracked search.
Under it, one sentence says what buying the missing clicks with Google Ads would cost each month at Google's own cost per click for those searches, next to the reminder that earning them through your listing, reviews, and website is free. The competitor board is re-framed the same way, each business's clicks priced in dollars a year, and a table at the bottom lists the clicks you are missing search by search with the ad budget it would take to buy them.
One more chart, What people search for vs what you sell, groups local searches by service (hitting, pitching, catching, camps and clinics, teams and leagues, softball, cage rental, memberships, and so on) and compares them with what you actually run, based on your events in the last year, active memberships, and landing page. Each bar is Not offered, Offered but losing, Offered and winning, or Offered but not tracked yet. Demand you are not selling into is hard to miss.
Growth
Where Ridgeline Baseball Academy stands in local search, what the next level is worth in revenue, and which local demand you are not selling into yet.
Where you are and what the next level is worth
Clicks from Google Maps each month across your 6 tracked searches (540 searches a month), and what they turn into over a year if 5% of them become customers worth $2,612 each ($138,412 from 53 paying customers in the last 12 months).
Today
5% of Google Maps clicks
Next level
Match Velocity Sports Complex
Ceiling
#1 in every tracked search
Buying the leader's extra 33 clicks a month with Google Ads would cost about $19 a month at Google's average cost per click for these searches. Earning them through your listing, reviews and website is free.
Want help getting to the next level?
Baseline's marketing team can capture the missing local clicks for Ridgeline Baseball Academy, worth about $51,177 a year at your current customer value.
Who takes the clicks, and what they are worth
You and the competitors you chose in setup: share of the estimated Google Maps clicks across your tracked searches, and what those clicks are worth a year.
Found in 3 of 6 searches · best position #2
13% · ~21 clicks a month
worth ~$32,631 a year
Found in 6 of 6 searches · best position #1
9% · ~15 clicks a month
worth ~$22,842 a year
Found in 6 of 6 searches · best position #3
9% · ~14 clicks a month
worth ~$22,508 a year
Found in 5 of 6 searches · best position #2
6% · ~9 clicks a month
worth ~$14,488 a year
Found in 6 of 6 searches · best position #1
5% · ~7 clicks a month
worth ~$11,475 a year
Want help getting to the next level?
How the numbers are estimated
Everything is labelled on the page, and the assumptions are simple enough to repeat.
| Measure | How it is calculated |
|---|---|
| Searches / month | Google's published monthly search volume for the phrase in your area. |
| Clicks (Google Maps) | About 30% of searchers click a Maps result, weighted heavily toward the top positions. |
| Clicks (Google Search) | About 28% click the #1 organic result, decaying by position down page 1. |
| Clicks (AI answers) | About 6% click a cited source, shared equally between the sources cited. |
| Missing clicks | What the #1 business gets on that search, minus what you get. |
| Customers | 5% of clicks. |
| Customer value | Your net revenue over the last 12 months divided by your distinct paying customers, from Baseline payment data. |
| Ad budget | Missing clicks multiplied by Google's cost per click for that search. |
What runs on its own, and what does not
- Weekly snapshots. Every Monday, for each facility that has completed the analysis, Baseline re-runs the Maps searches, refreshes Search and AI results, and records that week's position on every tracked search.
- Alerts. After each snapshot, this week's Maps position is compared with last week's. Each facility admin gets one in-app notification when you drop three or more places, fall out of the top 20, or reach #1. Opening it lands on Local Traffic for that facility.
- Reviews and Listing are on demand. Fetch reviews and Check your Google Business Profile run when you press them, or the refresh icon, so costs stay predictable. The page shows the cost of each fetch, a fraction of a cent per business.

What Successful New Sports Facilities Do Differently
The facilities that grow fastest are the ones families can find. This is the part of that we could measure for you.
Read the studyGood to know
- Leaderboards default to the competitors you chose in setup. A big competitor you did not choose appears after Show everyone.
- Revenue figures on Growth stay hidden until your facility has paying customers in Baseline.
- Review counts use the 20 newest reviews per business, so the 90-day count caps at 20.
- The You dot on the map is your confirmed Google listing's location, which can differ from your address on file.
Get started
- Open Marketing from the side navigation and press Run analysis.
- Confirm your listing, then choose your competitors and finish setup.
- Open Reviews and reply to anything marked No reply, lowest ratings first.
- Open Listing and clear the items marked Missing.
If you're already on Baseline, Marketing is in the side navigation. If you're not, see how local search visibility fits into the rest of the platform at baselinepro.com, or check pricing and packages.
Be found. Be chosen.
Baseline is the all-in-one operating system for sports facilities, clubs, and travel teams — scheduling, payments, programming, and team management in one platform.
Keep reading

What Successful New Sports Facilities Do Differently
A data-backed operator playbook from Baseline cohort research: the four operational levers that move the needle in a facility's first year — and the four things you can stop worrying about.

The Secrets of Scaling to a $1M Sports Training Facility
Only 7% of sports training facilities ever reach $1M in annual revenue. Drawing on operator data presented at the ABCA convention, here are the patterns that separate them — and the myths that don't matter.
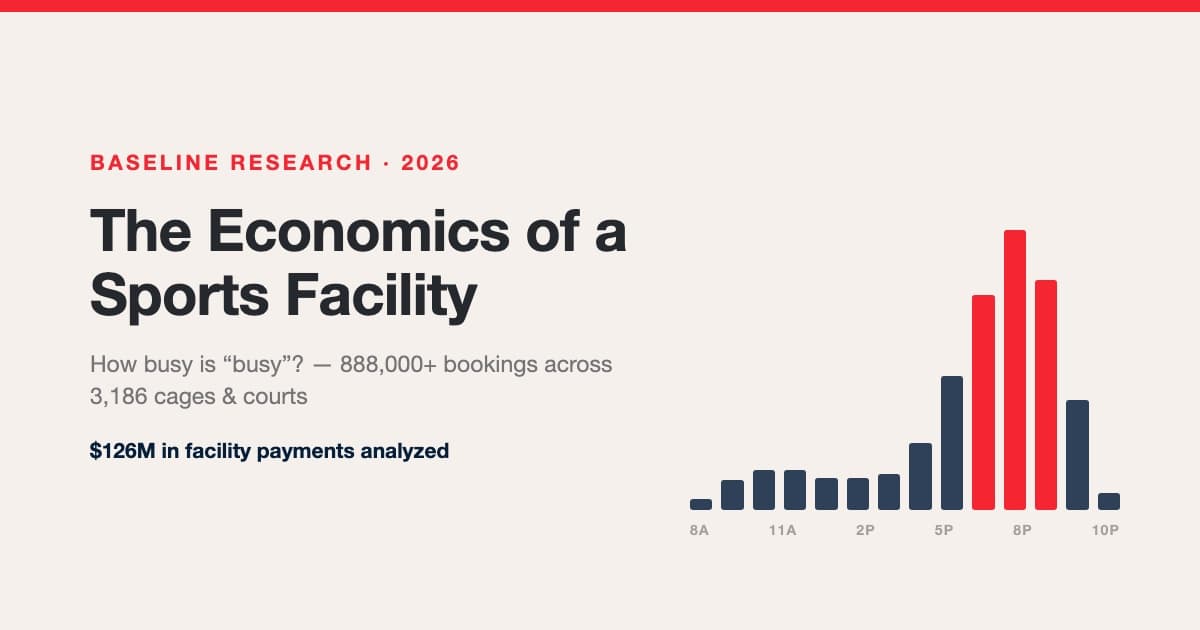
The Economics of a Sports Facility: How Busy Is Busy, What a Space-Hour Is Worth, and How the Packed Facilities Got That Way
We analyzed 888,000+ bookings, 863k space-hours, and $126M in payments across hundreds of sports facilities. Real utilization benchmarks (facilities are spiky, not empty — 2 in 3 sell out prime hours while averaging ~19% occupancy), rentals vs lessons vs group economics, the true lesson margin after trainer splits, credit-pack accounting, seasonality by category, and the occupancy ladder from quiet to packed.