
The State of Youth Team Registrations: What Club Sports Costs, How Parents Say Yes & Where the Money Moves
We analyzed 65,000+ roster spots and $85.7M in team fees across 337 club businesses in 49 states. What a season really costs by age and state, the $300 deposit standard, the ~15-point collection tax on cash-and-check dues, the 3x recollection gap between clubs — and the one screen where families pause on the way to a completed registration.
We studied a cohort of 337 established youth sports club businesses we hold multi-year, longitudinal data for — 65,000+ roster spots across 8,079 teams in 49 states, $85.7M in team fees — to answer the questions every club director and every sports parent asks: what does a club season really cost, how do families actually say yes to a roster spot, what makes them abandon registration, and what happens to all those payment plans after the excitement wears off. This is the most complete public picture of youth team registration we know of. All of it is below, free.
About this study
Nine findings that explain how club sports really gets paid for
- A roster spot is a four-figure commitment that parents accept in minutes. The median team's committed season cost is $1,540 — and a parent who opens a registration link finishes in a median of ~20 minutes. Nearly half of self-serve registrations are done in under 15.
- Families almost never say no — they just don't finish on their own. Explicit declines are 1.8% of invitations. But 1 in 5 families accepts a spot without completing registration unprompted — committed revenue that paper-and-spreadsheet registration never even surfaced. The flow data shows exactly where they pause: half of mid-flow stalls sit one screen from done, at the payment step.
- The $300 deposit is the industry's handshake. 55% of installment plans front-load a smaller first payment (median $300, about 16% of the season) — and 46.5% of those label it an explicit deposit or commitment fee.
- Pay-in-full is the exception. Only 21.4% of plan configurations collect everything upfront. The standard product is ~$300 a payment stretched over ~100 days — club sports runs on installments.
- Moving payments online is worth ~15 points of collection. Online team dues collect at 98.2% of dollars; offline cash-and-check dues collect at 83.6%. The gap holds inside the same club running both rails. Most of youth sports' bad debt is a rail problem, not a family problem.
- Failure compounds with every additional payment. Across three years of installment history, payment #1 fails 0.6% of the time; payment #9 fails 4.5% — a 7–8x escalation baked into long payment plans.
- Clubs ultimately collect ~96% of matured team-fee dollars. And most of what's never collected isn't card declines — it's cash-and-check dues recorded offline and never confirmed.
- The recollection gap is operational, not luck. The best-recovering half of clubs wins back 81.1% of failed payments; the bottom half 28%. The separator in the data is automatic retry coverage (26.7% vs 11.3% of dues on auto-collect), not how many reminder messages get sent.
- The paperwork is lighter than the lore. The median team asks 4 questions and 1 signed contract (median 573 words). Almost a third of teams ask nothing at all — and completion rates barely move either way. The wall is money, not forms.
Part 1: How a roster spot actually happens
Youth team registration looks nothing like e-commerce, and the data shows why: it's an invitation economy. A club builds a team, attaches payment plans, questions, and contracts to it, and then fills the roster through three doors — a shareable registration link (tryout announcement in the group chat), a direct invite to a specific family ("your son made the team"), or the club importing players it already has straight onto the roster.
The import share is the first finding hiding in plain sight: for most spots, the club does the data entry, not the parent. Where families do register themselves, the invitation carries an offer letter — and clubs write them like acceptance letters, not invoices. Across 633 unique offer templates from 120 clubs, 67.5% open with welcome/congratulations language, 11.1% mention the deposit, and the median letter runs 55 words.
"This deposit of $500 locks in your roster spot for the 2026–2027 season. Followed by 10 monthly payments of $325." — the modern youth-sports acceptance letter, verbatim pattern from the data
Behind the letter sits a menu: 45% of invites offer exactly one payment plan, 21% offer two, and a quarter offer three or more. The median team maintains 3 distinct plan configurations — usually a pay-in-full option next to an installment schedule, sometimes a sibling discount tier.
The registration flow, front to back
- 1. Accept the spot — one tap from the invite (or decline, with a reason).
- 2. Answer the club's questions — jersey size, birthday, positions…
- 3. Sign the contracts — waivers, codes of conduct, payment agreements.
- 4. Pick a plan & add a payment method — the single screen where half of all mid-flow abandonment happens.
Part 2: Saying yes — the funnel and the 20-minute decision
Follow the 10,684 invitations on teams that ran a real invited registration (at least 3 invited families, 116 clubs): 84% accept the spot, 64% finish registration end-to-end — and only 1.8% ever press the decline button.
The gap between accepting and finishing is the industry's oldest leak — and until registration moved onto software, it was invisible. A club running paper forms and spreadsheets simply never found out which families said yes and then drifted. Instrumented registration surfaces it precisely: 20% of invited families accept a roster spot but don't complete registration on their own. They aren't saying no — declines are a rounding error — they're saying "not right now." And the flow data pinpoints where: of players who started and stalled, 50% cleared the questions and signed the contracts, then paused at the plan-and-payment screen.
The wall is money, not forms
And when families finish, they finish fast — a flow that used to mean a clipboard, a paper check, and a week of back-and-forth now fits between dinner and bedtime. A parent who opens a registration link completes the whole thing — plan choice, payment method, questions, signatures — in a median of 19.4 minutes. 57% finish within the hour; 46.6% in under 15 minutes. Direct invites move on a different clock: the median family responds to a personal invite in about 17 hours (p90: 8.5 days) and wraps registration in a little over a day — the invite sits in the inbox, the decision happens at night.
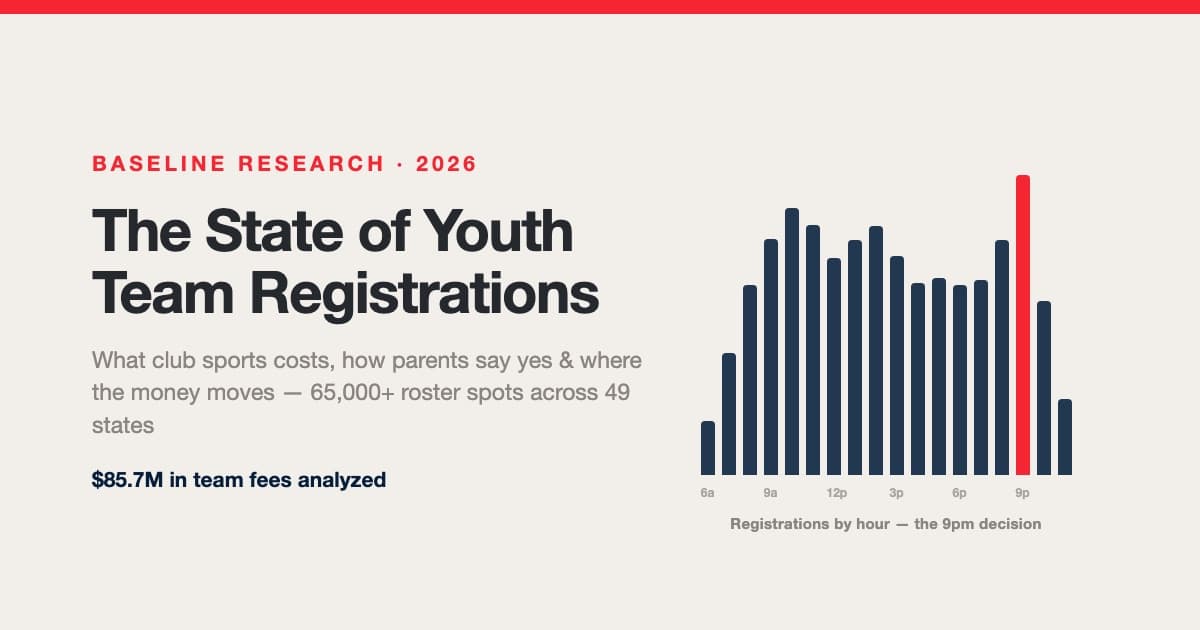
The weekly rhythm matches every parent's lived experience: registrations peak Tuesday–Thursday and crater on Saturday — game day. If you're a club director, your registration emails are being opened from the bleachers, but the checkout happens at 9pm on a Wednesday.
Part 3: The price of a season
Across 6,197 priced teams at 266 clubs, the median committed season cost — every required installment summed, add-ons excluded — is $1,540 per player. The middle half of teams sits between $769 and $2,500; one team in ten commits families to $3,485 or more. (Weighting each club once instead of each team once gives $1,500 — large multi-team organizations pull the team-weighted number slightly up.)
The age ladder is steady and steep: every step up in age brings roughly 15–25% more cost, from $1,325 at 8–10U to $2,313 at high-school age. More travel, more tournaments, more coaching — the bill grows up with the kid.
Regionally, the South registers the lowest committed costs (tenant-weighted median $1,170) against ~$1,650–$1,799 everywhere else — the same geographic gradient we found in membership pricing, showing up again in team fees.
The installment machine
How that $1,540 gets paid is the real story. Only 21.4% of distinct plan configurations are pay-in-full. Everything else is a schedule: median installment $300, median plan span 100 days, stretching to 10, 12, even 13+ payments at the tail.
And leading the schedule, the handshake: 55.1% of installment plans front-load a smaller first payment — median $300, or about 16% of the committed total. 46.5% of plans name it outright ("deposit," "commitment fee," "roster fee"); the rest are structured the same way without the label. The deposit does exactly what the offer letters say it does: it locks the spot, transfers commitment, and moves the real bill to autumn.
For club directors: the deposit norm
Part 4: How the money actually moves
Team fees ride three rails. By dollars, cards carry roughly two thirds, bank transfers (ACH) about a quarter — and old-fashioned offline money, the cash envelopes, paper checks, and Venmo screenshots, still moves about a tenth of the industry. Among the third of families with a card on file, 72% are using a credit card (27% debit) — Chase is the #1 issuing bank in the dataset, and yes, the Costco card makes an appearance.
What fails, and what comes back
Failed payments are rarer than club-director folklore suggests — and more recoverable. Across three years of installment history, 2.3% of matured installments ever hit a failed collection attempt. When a payment does fail on a stored payment method, recovery is quick: the median recovered failure clears in about 3 days as retries run. Failures that survive 90 days, on the other hand, rarely come back at all.
Youth sports payments are fast-or-never: a failed installment either recovers within days on auto-retry, or it quietly becomes bad debt.
Half of explained failures are one phrase: insufficient funds. This is not fraud, expired plastic, or forgetfulness — it's cash-flow timing in family checking accounts. Which is exactly why retry cadence beats everything else: the money usually arrives a few days after the due date does.
The long game: across $78,028,209 of matured dues in the 2023–2026 installment ledger, clubs collected 96.3% of every dollar. Of the $2,880,168 that never arrived, the majority — $1,658,411 — is offline dues (cash and checks recorded but never confirmed), not card failures. The digital rails, left to retry, mostly collect themselves.
The offline tax
Put those two facts together and the biggest money finding in this study falls out. Split every matured due by rail: online dues collect at 98.2% of dollars; offline dues collect at 83.6%. And this isn't "good clubs go digital" composition: among the 94 clubs running meaningful volume on both rails, the median club collects 98.9% of its online dues and 88.3% of its offline dues — the same families, the same club, a ~10-point gap decided by the rail.
A club that moves its cash-and-check dues onto a stored payment method doesn't just save bookkeeping time — at these collection rates it keeps roughly an extra 15 cents of every formerly-offline dollar. The check that's "in the mail" is the single most expensive payment method in youth sports.
The recollection league table
"Mostly" is doing real work in that sentence, because the spread between clubs is enormous. Among clubs with enough failures to measure, the best-recovering half wins back a median 81.1% of failed payments. The bottom half: 28%. Same sport, same parents, same economy — a 3x gap in getting paid.
Retry beats reminding
Offline money is now measurable too. Baseline's daily offline payment reports give cash and check activity its own exports, payment notes, and recollection data, so the rail that used to disappear into a shoebox shows up next to cards and ACH.
Part 5: The paperwork — questions, waivers, contracts
Registration forms have a reputation as the DMV of youth sports. The data says the industry has already fixed most of that: the median team asks 4 questions, and 29.6% of teams ask none at all. The top quartile asks 10+, and a heavy-form tail asks 17 or more. Only 7.3% of the question slots families actually see are optional — clubs that ask, require.
The list reads like a locker-room checklist: contact info, jersey and apparel sizes, birthdays, positions, school and grad year. Medical and emergency-contact questions — the ones tournament directors assume everyone collects — appear on far fewer registrations than jersey sizes do. A family completing a typical registration answers a median of 7 questions (on teams that ask any).
Contracts are the heavier half of the paperwork. The median team requires 1 signed document; a quarter require 3 or more. The median team contract runs 573 words — a two-minute read — but the p90 is 1,673 words and the longest in the dataset is 8,408 words of liability language. Families have signed 117,990 of these e-signatures on team contracts to date; less than 1% of players handle contracts on paper anymore.
The form isn't the funnel-killer
Since this study was published, the paperwork layer got stricter and cleaner: registrations can now require a real drawn signature, signed waivers save to both the signer and the athlete they signed for, and drawn signatures are embedded in the signed document itself.
Part 6: The rhythm of the season
Roster-building runs on a school-year heartbeat. Within 2025 — the last complete year — roster completions peak hard in June–August (tryout and commitment season) and bottom out in April, mid-season, when rosters are locked and nobody is joining anything.
Rosters themselves are remarkably standard: the median team completes 10 players (p90: 14) — baseball-shaped numbers, a starting nine plus bench. Age-wise, 12U is the center of gravity of club sports, with a broad hump from 8U to 16U:
Once invitations go out, filling is quick: teams that registered mostly through invites reached 80% of their final roster in a median of 9 days (a figure that will read slightly fast until a full fall cycle is observable). Families, meanwhile, are repeat customers: 28.6% of paying parents have registered more than one roster spot — siblings, second seasons, second sports — and among clubs active in both 2025 and 2026, 16.7% of 2025 families had already registered again by July 2026, with the fall wave still to come.
Part 7: What trips people up — and where registration goes next
We tested the obvious suspects against completion rates, and most of them are innocent. Price? Teams under $500 and teams over $3,500 complete at nearly identical rates — within the same club, higher-priced teams complete just as often as cheaper ones (median within-club difference: 0.0 points). By the time a family reaches registration, the buying decision is made; the checkout is a formality until the payment screen makes it real. Question count? No consistent effect. Deposits? Teams with deposit-led plans complete slightly better (median 72.7% vs 66.7%) — commitment devices work both ways.
| Suspect | Verdict | The evidence |
|---|---|---|
| Season price | Innocent | Median completion 69–76% in every price band; within-club test flat |
| Question count | Innocent | Zero-question and 10–19-question teams complete alike |
| Contracts | Innocent | No dose-response across 0/1/2/3+ required documents |
| The payment screen | Guilty | 50% of mid-flow stalls end there, after questions & contracts are done |
| Deposits | Accomplice (helpful) | Deposit-led teams complete at 72.7% vs 66.7% median |
Which points at where the industry is heading. The friction that remains in team registration is concentrated in one moment — a parent, at 9pm, being asked to type a card number into a phone. The newest answer in the data is conversational: registration by text message. Every club on the platform now ships with an AI registration agent on its own phone number — a parent can accept a roster spot, answer the club's questions, get payment links, and finish registration in an SMS thread, and the agent chases incomplete registrations instead of the club director. It's early (the feature shipped in 2026, and its conversation logs live outside this study's dataset), but it's aimed squarely at the 50% who stall at the money screen — and at the 21.2% of directly-invited families who never respond at all.
Where the next study picks up
The club director's playbook: ten moves, ranked by leverage
Everything above, compressed into the checklist worth taping to the office wall:
| # | Move | The number behind it |
|---|---|---|
| 1 | Put every plan on auto-collect with a stored payment method — make offline the exception | Best-recovering clubs: 81% recovery at 26.7% autocollect share vs 28% at 11.3% |
| 2 | Lead with a ~$300 deposit (15–20% of season cost), balance on installments | 55% of plans already do; deposit-led teams complete 6 points better |
| 3 | Chase the accepted-but-incomplete list weekly — they said yes, they just didn't pay | 20% of invited families accept without finishing on their own; half of stalls sit one screen from done |
| 4 | Let the retries run before you call — failed ≠ lost | Recovered failures clear in ~3 days median as retries run; failures older than 90 days rarely come back |
| 5 | Keep plans to ~6 payments or fewer where you can | Failure rate climbs every installment: 0.6% on #1 → 4.5% by #9 |
| 6 | Move cash-and-check families onto any digital rail — even ACH | Online dues collect at 98.2% vs 83.6% offline — a ~15-point tax on every offline dollar |
| 7 | Send invites Tuesday–Thursday, expect the 9pm decision | Direct invites are answered in ~17h median; completions peak at 9pm, die on Saturdays |
| 8 | Don't fear the questionnaire — collect what you need (including medical) | Question count shows no completion penalty; medical info trails jersey sizes today |
| 9 | Write the offer letter like an acceptance, price included | 67% of offer letters already lead with "welcome" — the ones that state the deposit up front convert commitment on the spot |
| 10 | Benchmark your price against the age ladder, not the club next door | $1,325 (8–10U) → $2,313 (15–18U) median; the South runs ~30% below the coasts |
Team fees are the single biggest revenue category in youth sports facilities — bigger than memberships, lessons, or rentals. The machine that collects them is invitations, deposits, installments, and retries. Every move above is about keeping that machine from leaking.
Baseline's team registration tools automate most of this playbook — invite links and direct invites, deposit-led payment plans, automatic retry and recollection, registration-by-text, and a live funnel view of who's stuck where. See it live.
Methodology
Data. Aggregated, anonymized operational data from a longitudinal research cohort of 337 established youth sports club businesses running team registrations on the Baseline platform across 49 U.S. states — selected for the multi-year operating history the payment-lifecycle and seasonal analyses require, and not representative of the platform's full or current customer base. The cohort spans 8,079 teams, 65,408 roster spots, 26,830 invites, 25,367 distinct payment-plan configurations, 1,019,394 registration answers, 117,990 team-contract signatures, and $85.7M in collected team fees, July 2023 through July 9, 2026.
- Anonymity. Every published figure aggregates at least 5 distinct businesses. State and region figures are medians of per-team medians and carry concentration warnings where one organization dominates a state.
- Verification. Every headline number in this report was re-derived independently by an adversarial review that attempted to refute it — checking denominator choices, era mixing, import contamination, duplicate records, and single-club domination. Numbers that didn't survive were corrected or cut; the caveats below are what that audit demanded we tell you.
- Channels. Funnel and timing statistics use only organically-registered players (self-serve link or direct invite). Roster spots imported by club admins (77% of all spots — returning players, migrated history) are excluded from behavioral metrics because their timestamps reflect admin data entry. Self-serve link registrations only create a record once a visitor signs in, so link-channel non-response is a lower bound and the two channels' response rates are not directly comparable.
- Prices. Committed season cost = the sum of a plan's required installments (optional add-ons excluded — they appear on 0.1% of plans). Plan configurations are deduplicated (the platform historically minted a copy per invite); team price = the median across the team's distinct plans. Cross-checked against plan names ("$3,125.00 in 6 payments"): 97% agreement.
- Payments. Collection metrics separate two books: point-of-sale charges (recorded on success — collection is ~100% by construction and says nothing about performance) and scheduled installments with real due dates. Failure, recovery, and rail-comparison figures come from three years of installment-ledger history (2023–2026); "matured" means due at least 60 days before the study cutoff. A failure is a recorded failed status or a payment needing more than one collection attempt; the online-vs-offline comparison uses dollars due, and the within-club version is restricted to clubs with at least $5k of matured dues on each rail.
- Limits. Observational data from an established cohort of one platform's clubs, which skew toward baseball and softball organizations; because the cohort is selected for multi-season operating history, it is not a representative sample of all youth sports clubs — treat the figures as benchmarks from mature programs, not population estimates. The self-serve invited flow launched platform-wide in May 2026, so behavioral funnel metrics cover a summer of data, not a full annual cycle, and returning-family rates are right-censored (fall 2026 hadn't happened yet). Cross-club comparisons (deposits, recollection practices) compare different businesses, not randomized groups — where self-selection plausibly explains part of a gap, we say so in place.
Questions about the data, or want a cut we didn't publish? Get in touch — we're happy to run custom aggregates for press and researchers.
Baseline is the all-in-one operating system for sports facilities, clubs, and travel teams — scheduling, payments, programming, and team management in one platform.
Keep reading
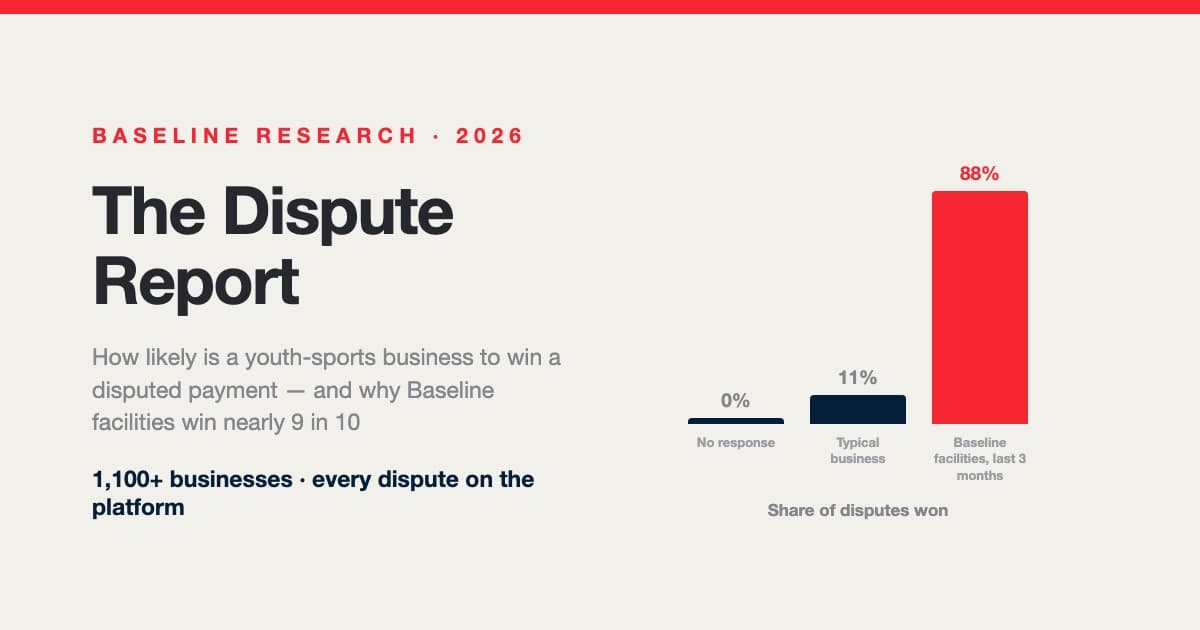
The Dispute Report: How Likely Is a Youth Sports Business to Win a Payment Dispute — and Why Baseline Facilities Win Nearly 9 in 10
Industry-wide, businesses answer barely half of their chargebacks and recover about 1 in 10. Across Baseline's platform of 1,100+ youth-sports businesses, 88% of closed disputes were won over the last three months — with 90% of responses filed without anyone touching a thing. How disputes actually work, what gets disputed at sports facilities (and which purchases win), why fraud codes are hardest, what each card network wants, and the pre-documented evidence system behind the numbers.
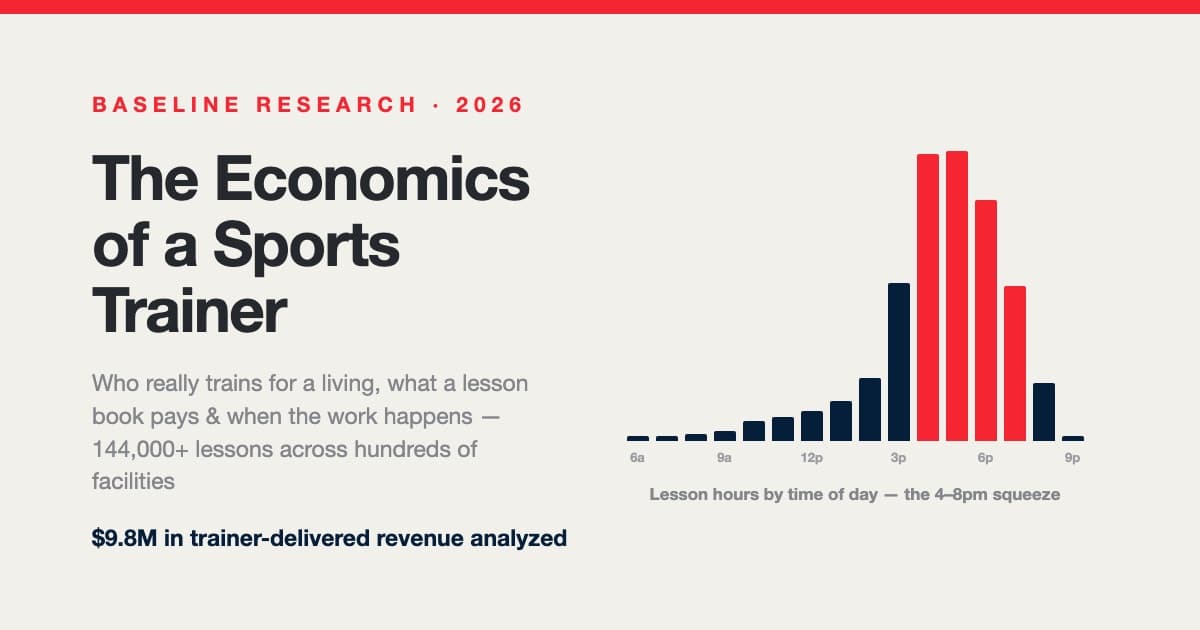
The Economics of a Sports Trainer: Who Trains for a Living, What a Lesson Book Pays, and Why the 4–8pm Wall Decides Everything
Inside a research cohort of training facilities: the full-time lesson trainer is nearly mythical (median 3.3 delivered hrs/week; 4.4% sustain 15+), the trainer split is a spectrum anchored at 50% and 60% that realizes near 47%, lessons run ~$104/hour in every discipline but strength, the median client book is 8 actives on a 90-day clock, and continuing books swing from −61% to +192% in a year — the numbers behind hiring, comp design, and the dependence ledger.
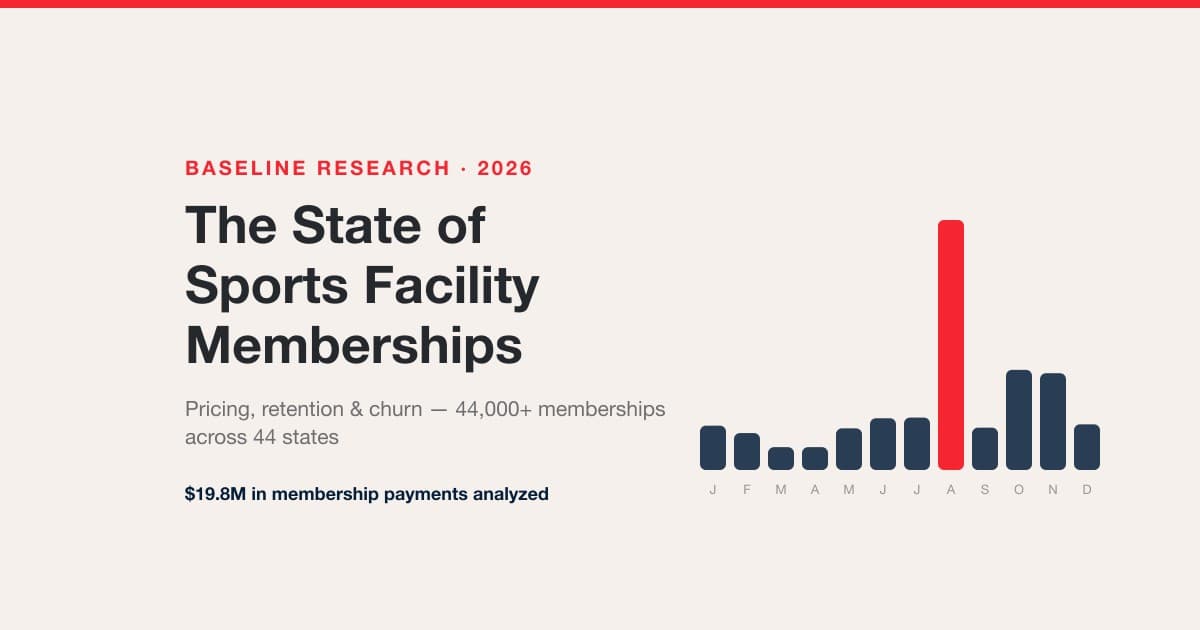
The State of Sports Facility Memberships: Pricing, Retention & Churn Across 44,000+ Memberships
We analyzed 44,000+ memberships and $19.8M in membership payments across hundreds of sports facilities in 44 states. What facilities charge by state, which membership styles retain, why annual billing doubles lifetime value, and the churn playbook the data supports.