
The Economics of a Sports Facility: How Busy Is Busy, What a Space-Hour Is Worth, and How the Packed Facilities Got That Way
We analyzed 888,000+ bookings, 863k space-hours, and $126M in payments across hundreds of sports facilities. Real utilization benchmarks (facilities are spiky, not empty — 2 in 3 sell out prime hours while averaging ~19% occupancy), rentals vs lessons vs group economics, the true lesson margin after trainer splits, credit-pack accounting, seasonality by category, and the occupancy ladder from quiet to packed.
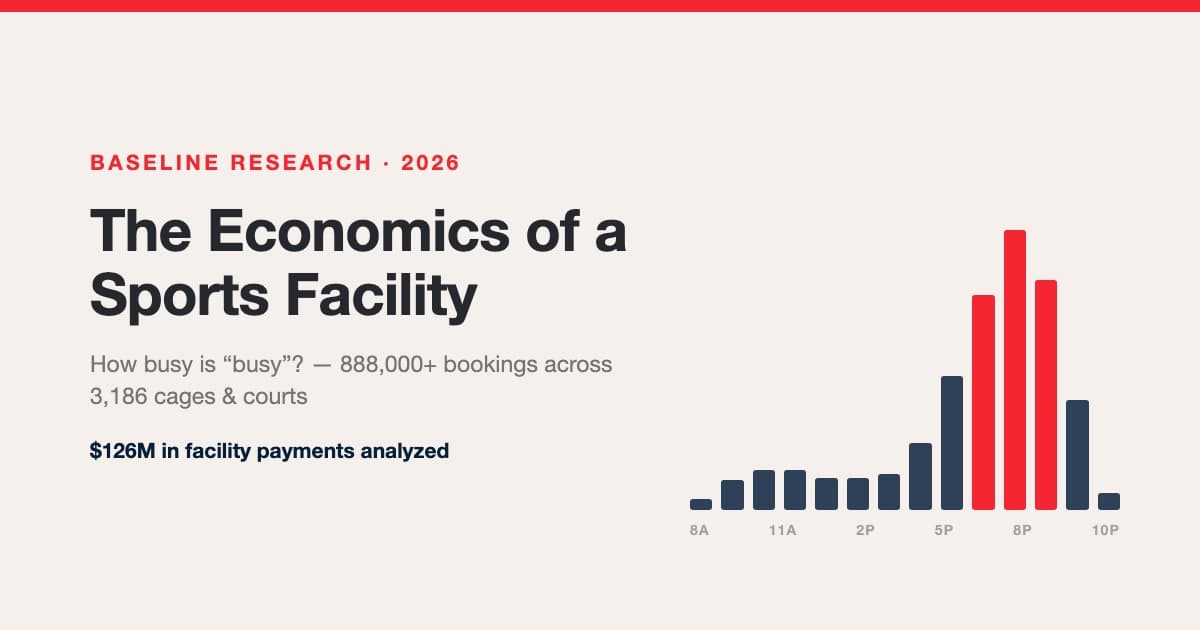
We analyzed 888,000+ bookings — 863k service hours across 3,186 cages, courts, and training spaces at hundreds of sports facility businesses, and $126M in collected payments — to answer the questions operators actually argue about: how full is a “full” facility, what a space-hour is really worth in rentals vs lessons vs group programs, what seasonality genuinely looks like, and how the busiest facilities in our data got that way.
About this study
Nine findings that should change how you run your building
- Facilities are spiky, not empty — and both halves matter. The median established facility fills 19% of prime-time space-hours on average, yet two thirds completely sell out at least one prime hour during the year, and the median one runs 67% full in its 95th-percentile hour. “We’re slammed” and “most shelves are empty” are both true — the game is widening the sold-out peak, not arguing about the average.
- This is four different industries wearing one name. The #1 revenue source is team fees at 34% of facilities, memberships at 30%, lessons at 14%, and rentals at only 9%. We stress-tested this against credits and prepaid packs as stores of value — reallocating every prepaid dollar to the service it actually buys moves no category by more than a third of a point (see Part 5). Benchmarks that ignore your revenue shape will mislead you.
- A paid lesson hour grosses 2× a paid rental hour — and nets about the same. Median realized rates: $91/space-hour for directly-paid lessons vs $45 for paid rentals. But where trainer payouts are tracked, the median split sends 50% to the trainer — so the house keeps roughly a rental’s worth. Lessons win on demand and retention, not on per-hour margin.
- Rentals are just-in-time inventory. The median rental is booked less than a day ahead; lessons 4 days; group events 23 days; enrollment series 38 days. Program inventory is sold weeks out — rentals fill whatever is left, tomorrow.
- Seasonality is real but smaller than the lore — except in occupancy. Total same-store revenue swings from index 132 (January) to 81 (the late-spring trough) — nowhere near the “70–80% of revenue in the cold months” rule of thumb quoted in the trade. But rentals swing 3.4×, and prime-time occupancy runs ~4× between February (33%) and July (8%) — the building itself has seasons even where the P&L doesn’t.
- Recurring revenue cuts volatility nearly in half. Facilities earning most of their revenue from memberships see month-to-month revenue variation of 30% vs 48% for facilities with almost none.
- Paid credits get used; free ones quietly don’t. Purchased credit packs redeem at 86% at the median facility (breakage right in line with the 10–19% gift-card norm) — but across all granted credits, including membership freebies, median redemption is only 34%.
- Packed facilities aren’t more senior — they’re built differently. Median platform tenure is ~18–20 months in every occupancy tier. The top tier runs 72% of its hours as group formats (vs 42% in the quiet tier), earns $23 per prime capacity hour (vs $7), sells out 79 prime hours a year (vs zero), and holds ~5× the waitlists.
- The real leak isn’t the awkward 20-minute gap — it’s whole empty hours. On days a space gets used at all, scheduling is tight: 85% of the first-to-last-booking span is filled, and stranded sub-45-minute gaps cost only ~3 minutes a day. The empty capacity lives in unsold day-parts and whole weekdays.
Part 1: Where the money actually comes from
Ask ten operators what a sports facility is and you’ll get ten answers, because the revenue engine underneath varies enormously. Across 257 businesses with a full trailing year of payments, the single biggest revenue category is different at different facilities:
Team fees — tuition for club teams, tournament fees, seasonal rosters — lead at more facilities than any other category. Memberships lead at nearly a third. And despite being the thing most people picture when they hear “batting cage business,” rentals are the top earner at fewer than one in ten facilities.
Read it as two questions: who sells this at all, and how big is it when they do. Team fees are the extreme: only 41% of facilities sell them meaningfully — but where they exist they consume 74% of revenue. Memberships are the broadest base (63% of facilities, 34% median share). Rentals are a real line at fewer than a third of facilities. The median facility collects $9,223/month through the platform; the 75th percentile $24,335, and the 90th $59,839.
What “maturity” does and doesn’t mean in this data
An honest caveat before any growth story: our clock starts when a business adopts the platform, and most facilities arrive as already-running businesses. A signal-based classifier (imported calendars, bulk member imports, revenue that starts flat instead of ramping) labels roughly 89 of 327 businesses as genuinely born on platform (only 44 under a strict from-zero rule) — the rest migrated in mid-life. So “facility age” below is platform tenure, not business age, and the two tell different stories:
- Across all facilities, revenue by tenure climbs from ~$2.3k/month in the first six months to ~$22k/month at 2–4 years — but much of that gradient is onboarding (more of the business moving onto the platform) plus cohort composition (the 2–4 year bucket is dominated by club/team organizations, median team-fee share 38%), not within-business growth.
- Among born-on-platform facilities, the story flips: they start membership-first — 26.1% of revenue from memberships in months 6–12 — and membership share drifts down as teams and programs layer on top. Recurring revenue isn’t the reward at the end of maturity; at successful new facilities it’s the foundation poured first.
Part 2: The real seasonal curve, category by category
Industry lore says indoor facilities make “70–80% of annual revenue in the three-to-five cold months.” Our same-store data says: only if all you sell is rentals. Below, each category’s monthly revenue index (100 = that facility’s own monthly average, so growth can’t masquerade as seasonality — see methodology):
- Rentals are the seasonal category — January indexes at 172, July–October at ~53: a 3.4× swing. When the weather turns, cash rentals evaporate.
- Lessons swing about half as hard (144 in January to 76 at the trough) — and lesson hours barely move at all. Winter lessons collect more revenue per delivered hour (rack-rate demand, packages bought up front); summer lessons run at loyalty rates.
- Team fees spike twice — August (166) for fall registration and January (154) for the new-year/ spring season. If you run teams, your cash calendar is registration-driven, not weather-driven.
- Membership revenue is the shock absorber: it stays within roughly ±25% of average all year — the flattest line on the chart, consistent with what we measured in the memberships study.
- Total revenue at the median diversified facility swings only ~±30%. The November–February stretch delivers about 38% of annual revenue — meaningful, but a far cry from 70–80%. The facilities that do live and die by winter are the rental-dependent ones.
Season playbook
Part 3: How busy is “busy”?
Utilization talk in this industry is foggy because nobody agrees on the denominator. We use space-hours: one atomic cage, court, or training area for one hour — where “atomic” does real work. Facilities routinely model space hierarchically (a full court that splits into halves, a tunnel inside a turf area), and counting parent and children as separate spaces both inflates capacity and double-counts usage. We resolved every facility’s catalog to its leaf units (details below and in the methodology). The median facility business runs 7 such spaces and a 60-hour operating week — about 420 sellable space-hours every week. Here’s when demand actually shows up:
The industry runs on a ~25-hour prime window: Monday–Thursday 4–9pm plus weekend mornings. Tuesday 6–7pm is the single busiest hour of the facility week; Friday evening is half a normal weekday; weekends flip to the morning. Now the uncomfortable part — how much of that window is actually sold:
Both halves of that chart are the finding. The peak is real: two thirds of established facilities hit at least one completely full prime hour a year, the median one’s busiest hour is 100% booked, and its 95th-percentile prime hour runs 67%. The average is also real: across all 39 prime hours of the week, the median established facility fills 19% (top decile 36%; across all facilities including partially-onboarded ones, 15%). Software-industry chatter about “70% utilization is healthy” describes class-fill at studios, not wall-to-wall space capacity. The honest picture is a steep demand mountain: sold out at the summit, mostly open on the slopes.
“Full” is real — for about 40 prime hours a year at the median facility. The other ~1,900 prime hours are inventory.
How facilities carve up their space
22% of facilities model space hierarchically — a full court that sells as two halves, a turf area with tunnels inside it — and within those facilities a median 56% of booked space-hours land on sub-spaces. Slicing is how you sell one footprint at two price points, but measure it carefully: at facilities that nest, a median 10% of booked space-hours (75th percentile: 43%) have a parent and its child booked simultaneously — which naive reporting counts twice. We found 10,000+ bookings that list a parent and its own child on the same event. Every occupancy number in this report deduplicates those; most software (ours included, until now) does not.
What a space-hour earns
Two yield numbers matter, and they answer different questions. Revenue per used space-hour (are my prices right?) runs $47–$80 across occupancy tiers — quiet facilities sell few hours at high sticker, packed ones trade rate for volume. Revenue per prime capacity hour (am I filling the building?) medians $7 in the quiet quartile and $23 in the packed one — against a median list price of ~$50 for a 60-minute rental. That gap between what an hour sells for and what the average prime hour earns is the entire growth opportunity of a typical facility.
Part 4: Rentals vs lessons vs group events — the space-hour P&L
Every hour on your calendar gets paid for in one of three ways: someone pays for the slot (a booked rental, a lesson charged at checkout), someone burns a credit they bought earlier in a pack, or the hour was sold in advance as part of a membership, team fee, or enrollment — so the slot itself looks free. Compare booking types on the first lens alone and you’ll misjudge everything, so here are all three, side by side:
| Type | A directly-paid hour earns | The average delivered hour earns | Hours pre-sold via memberships & teams |
|---|---|---|---|
| Lessons | $91 | $64 | 19% |
| Group events | $69 | $13 | 44% |
| Enrollment series | $62 | $39 | 3% |
| Rentals | $45 | $12 | 74% |
How to read this table
The lesson-margin illusion
Lessons are the highest-grossing use of a space-hour: $91 per paid space-hour at the median facility, roughly double a paid rental. But lessons are the only booking type with a built-in revenue share. Across facilities that track trainer payouts in the platform, the median payout is 50% of the lesson price (25th–75th percentile: 39%–67%).
| Per prime space-hour | Paid rental | Paid lesson (50% split) | Paid group event |
|---|---|---|---|
| Gross collected | $45 | $91 | $69 |
| Trainer / coach cost | $0 | −$45 | one coach, many payers |
| House keeps | $45 | ≈$45 | most of $69 |
At the median split, the house nets about the same from a paid lesson hour as from a paid rental hour — before scheduling overhead, no-shows, and payroll admin. That is not an argument against lessons: lessons create the relationships that become memberships, teams, and referrals, and lesson demand is far deeper than rental demand. It is an argument against celebrating lesson revenue without netting out the split — and for the group format, where one coach’s hour is sold to eight payers at once. Industry guidance says instructor splits should stay at or below 50%; a quarter of facilities in our data pay 67%+.
Watch the payout blind spot
When does a rental actually cost you money?
Operators worry about the mid-day rental that “blocks” the calendar. The data says the fear is mostly misplaced — and occasionally very right:
- Rentals arrive last-minute (median lead 0.9 days, vs 38 days for series enrollments). They tile into holes other bookings left behind — which is why rentals cause stranded gaps slightly less often than lessons do (5% vs 9% of bookings followed by an unusable <45-min gap).
- Fragmentation is a rounding error at most facilities: ~3 stranded minutes per space-day at the median. The median calendar gap is a fully sellable 60 minutes — the leak is unsold whole hours, not awkward slivers.
- Displacement is a prime-time, packed-facility problem. At the median facility (average prime occupancy 19%), a rental almost never displaces anything — the alternative was an empty cage, so take the $45. At a top-quartile facility with waitlists, a prime hour given to a rental instead of a group program forgoes roughly $24–$65 of yield — plus the retention value a program builds and a one-off rental doesn’t.
The rental release rule
Part 5: The recurring engine — memberships, credits, and honest accounting
The best revenue is the kind that shows up whether or not the phone rings. Here is what that is worth, measured: we split facilities into quartiles by how much of their revenue comes from memberships, then measured each facility’s month-to-month revenue volatility (coefficient of variation — lower is steadier):
Who actually consumes the zero-price calendar? Mostly teams, not gym-rat members. We probed every class of free booking: zero-price practices are team perks — 90% carry a team roster, effectively paid for by team fees — while zero-price group events are membership entitlements (a majority are gated to member plans, under 4% team-linked). Direct member consumption of the open calendar is smaller than operators fear: 5.0% of delivered space-hours at the median facility. Credit-pack consumption is bimodal — near zero at most facilities, but 21%–49% of all hours at the top quartile of credit adopters. Selling access instead of slots is a real inventory commitment — which is exactly why it retains.
Credits and prepaids: get the accounting right
Prepaid packs create the most confused reporting in this industry, because one credit touches your books three times: cash when the pack is bought, service when a session is redeemed (usually a $0 transaction), and margin when unused credits expire. Count the purchase and value the redemption and you’ve double-counted; ignore redemptions and your “Lessons” and “Rentals” lines understate what the building actually delivered. (This is also why the Part 1 mix survives the store-of-value objection: pack purchases are already stamped with the service category they store — we traced the residual credit-category cash, under 1% of all revenue, to its redemptions, and no category moved meaningfully.)
The good news: credits move fast — half are redeemed within ~11 days of being granted, so at monthly reporting grain, prepaid cash and prepaid service mostly land in the same month or the next. Purchased packs redeem at 86% (median facility) — the ~14% that expire are pure margin, right in line with the 10–19% gift-card breakage norm, and under ASC 606 that breakage should be recognized over the redemption pattern, not banked on day one. The sobering news: across all granted credits — including the free ones bundled into memberships — median redemption is just 34%. Members are paying for entitlements they don’t use; that’s margin today and churn tomorrow (unused benefits are the classic quiet-quit signal).
Report credits in three lines, not one
Part 6: From quiet to packed — the occupancy ladder
We took the established facilities (the ramped cohort from Part 3 — no partially-onboarded businesses diluting the picture) and split them into quartiles by average prime-time occupancy. Two honesty notes up front: tenure on the platform is ~18–20 months in every tier, so this ladder is an operating-model difference, not a seniority curve — and because most facilities arrived as mature businesses, we can’t claim any facility climbed these tiers over time. What we can say is what the packed quartile does differently, today:
| Per median facility in tier | Q1 quiet | Q2 | Q3 | Q4 packed |
|---|---|---|---|---|
| Avg prime-time occupancy | 0%–13% | 13%–19% | 19%–26% | 26%–100% |
| Fully-sold prime hours / year | 0 | 2 | 4 | 79 |
| 95th-percentile prime hour | 38% | 60% | 71% | 100% |
| Monthly revenue | $10,283 | $20,314 | $17,829 | $21,097 |
| Revenue per prime capacity hour | $7 | $13 | $13 | $23 |
| Revenue per used hour | $80 | $60 | $57 | $47 |
| Group formats, share of hours | 42% | 60% | 68% | 72% |
| Median paid lesson rate / space-hour | $47 | $46 | $44 | $57 |
| Events with waitlists (12 mo) | 2 | 6.5 | 7 | 10 |
Three things separate the packed tier, and none of them is “charge more for everything”:
- Group density. Packed facilities run 72% of their hours as group formats vs 42% in the quiet tier — practices, clinics, leagues, and enrollment series instead of a calendar waiting for one-off bookings. One coach, one space, many payers.
- A real sold-out peak. The quiet tier’s median facility never sells out a single prime hour (95th-percentile hour: 38%). The packed tier sells out 79 prime hours a year and runs effectively full (100%) in its top hours — that’s what fills waitlists (2 → 10 events) and creates pricing power.
- Volume over rate — except where labor is scarce. Revenue per used hour is highest in the quiet tier ($80) — few hours at high sticker — while the packed tier trades rate for volume ($47/used hour) and more than triples yield on capacity ($7 → $23). The one place the packed tier flexes price is lessons ($57 vs ~$46 in the middle tiers) — the only inventory constrained by coach-hours rather than space-hours.
The stage-by-stage playbook
Read the tiers as a to-do list keyed to your own average prime occupancy (measured the honest way — deduplicated, leaf-space, blocked time excluded):
- Stage 1 — Fill anything (under ~13% prime occupancy). Say yes to every rental; it’s found money and a lead list. Anchor 2–3 weekly group events so the calendar has gravity. Sell credit packs to create return visits (86% of purchased credits come back through the door). Your metric: weekly booked hours per space (median across the market is ~5h — beat it).
- Stage 2 — Build the base (~13–19%). Convert lesson regulars and pack buyers to memberships and enrollments; move recurring programs into fixed prime slots so new demand is forced to spread into shoulders. Watch the volatility chart above — this is where your winters stop being scary.
- Stage 3 — Go group (~19–26%). Every prime hour that hosts a 1:1 lesson is a candidate for a 6:1 clinic at a lower price per athlete and several times the yield per space-hour. Add enrollment series (sold 38 days ahead — they stabilize your forward book). Start gating prime rentals behind the 48–72h release rule. This is the tier where sold-out hours first appear — protect them.
- Stage 4 — Monetize scarcity (26%+). You’ll know you’re here when waitlists stack up and dozens of prime hours sell out completely. Raise lesson and prime-rental rates (the packed tier’s lesson rate runs ~24% above the mid-tiers’), push remaining 1:1 volume off-peak with pricing, and sell the off-peak day-parts (school-hours blocks, senior/homeschool programs, corporate) that the demand curve shows sitting at a fraction of evening demand.
The operator playbook: ten moves, ranked by leverage
| # | Move | The number behind it |
|---|---|---|
| 1 | Convert prime-time 1:1 lessons to group formats | Packed facilities: 72% group hours, 3× the yield per prime capacity hour |
| 2 | Measure prime occupancy weekly — deduplicated, per real space, and count your sold-out hours | Established median: 19% average, 36% top decile; packed tier sells out 79+ hours/yr |
| 3 | Net trainer payouts out of lesson revenue before comparing lines | Median split: 50% — a paid lesson nets ≈ a paid rental |
| 4 | Hold prime rental inventory until 48–72h out | Rentals book 0.9 days ahead — you lose almost nothing by releasing late |
| 5 | Sell credit packs hard in Nov–Jan, with 30–60 day expiries | January: credit sales index 158, redemptions 180; median redemption in ~11 days |
| 6 | Grow membership share of revenue past 50% | Cuts monthly revenue volatility from 48% to 30% |
| 7 | Reprice rentals seasonally — winter premium, summer discounts, posted openly | Rental demand swings 3.4× across the year |
| 8 | Sell summer in spring — camps and series enroll ~5 weeks out | Series lead time: 38 days; team fees peak in August (index 166) |
| 9 | Chase free-credit redemption, not just paid — unused benefits predict churn | All-credit redemption medians 34% vs 86% for purchased |
| 10 | Use waitlists as your price signal | Packed-tier facilities hold ~5× the waitlisted events of the quiet tier — and sell out 79+ prime hours/yr |
The through-line: a facility is an inventory business where the inventory expires every hour. The winners sell it in advance (memberships, enrollments, packs), sell it in bulk (groups), and let scarcity — not hope — set prices. Baseline’s scheduling and reporting tools automate most of this playbook, from utilization benchmarking to credit tracking and trainer payouts. See it live.
Methodology
Data. Aggregated, anonymized operational data from 327 sports facility businesses (549 locations) on the Baseline platform: 888,429 non-canceled bookings covering 863,145 service hours and $126.3M in collected payments, through June 2026. Obvious test accounts and businesses without meaningful activity (fewer than 200 lifetime bookings and 10 members) were excluded.
- Anonymity. Every published figure aggregates at least 5 distinct businesses; benchmarks are medians (or percentile ranges) of per-facility values.
- Occupancy. Computed hour by hour over the full year (not from an “average week,” which smears seasonal peaks and hides sell-outs). Numerator: concurrently busy spaces per hour, where each booking’s spaces are resolved through the facility’s space hierarchy to leaf units and overlap-deduplicated — a booking on a full court marks its halves busy, simultaneous parent+child bookings count once, and stacked events on the same space count once. Denominator: leaf spaces in use that year, minus time deliberately blocked off, in the facility’s local time zone. Prime = Mon–Thu 4–9pm, Fri 4–8pm, Sat 9am–5pm, Sun 10am–5pm (39 h/week). “Established facilities” = at least 10 active months, 500+ service space-hours, 70%+ of hours space-tagged, first 90 days of activity excluded — these are 44% of facilities but ~79% of tracked revenue (median revenue ~5× the excluded group), so all-facility medians are also shown. Numbers reflect the booked calendar: walk-ins and off-platform scheduling aren’t visible, so true physical utilization is somewhat higher.
- Space counting. Facility space catalogs are hierarchical: 22% of facilities nest sub-spaces inside parents, and 10,000+ bookings list a parent and its own child simultaneously. We collapse every catalog to atomic leaf units (mutually-exclusive configurations merged), which changes the naive space count by a median 16% at nesting facilities and prevents the double-counted usage that would otherwise overstate their occupancy by ~7% (median) — the corrections partially offset.
- Revenue attribution. Payments are linked to bookings through the platform’s transaction–event links; multi-session enrollments spread across their linked sessions. “Paid-only” rates divide linked revenue by hours of directly-paid slots; “all-in blended” rates add credit-redemption value — each redemption valued at its pack’s per-credit price and attached to the specific booking it consumed (97% join rate) — and divide by all delivered hours of the type. About 16% of attached credit value originates in membership-bundled packs, so all-in yields partially re-express membership revenue at the slot level and must not be cross-summed against category totals. Cash-basis timing checks show median payment-to-service gaps under a week for lessons and rentals (longer for events and series), so monthly seasonal indexes are not materially distorted by prepayment.
- Credits as stores of value. We verified the revenue mix against the objection that prepaid cash hides the real category: pack purchases already carry their service category at purchase, and the residual generic credit-category cash is under 1% of revenue ($740k/yr). Reallocating it to each facility’s redemption mix changes no category’s mean share by more than 0.3 points and flips no facility’s #1 category.
- Seasonality. Same-store indexes: a facility contributes a calendar year only if it was live before that year began and has twelve full months of data; each facility’s months are normalized to its own annual average before averaging across facilities, so growth cannot masquerade as seasonality.
- Trainer payouts. Computed from payouts recorded in-platform; facilities that pay trainers entirely off-platform don’t contribute, and the median facility records payouts on about half of lesson transactions — we report the split among transactions where it exists and flag the coverage limit in the text.
- Limits. Observational data from one platform’s customer base, which skews toward youth baseball/softball training businesses and program-led operations. “Facility age” anywhere in this report means platform tenure (the platform is ~3.5 years old); most facilities arrived as mature businesses — a signal-based classifier finds only ~44 that verifiably started from zero with us — so tenure gradients mix onboarding, cohort composition, and true growth. Occupancy tiers compare different businesses, not the same business over time; where operating model and business type plausibly explain part of a gap, we say so.
Questions about the data, or want a cut we didn’t publish? Get in touch — we’re happy to run custom aggregates for press and researchers.
Baseline is the all-in-one operating system for sports facilities, clubs, and travel teams — scheduling, payments, programming, and team management in one platform.
Take the full study with you
Download the complete research as a PDF to share with your team.
Keep reading
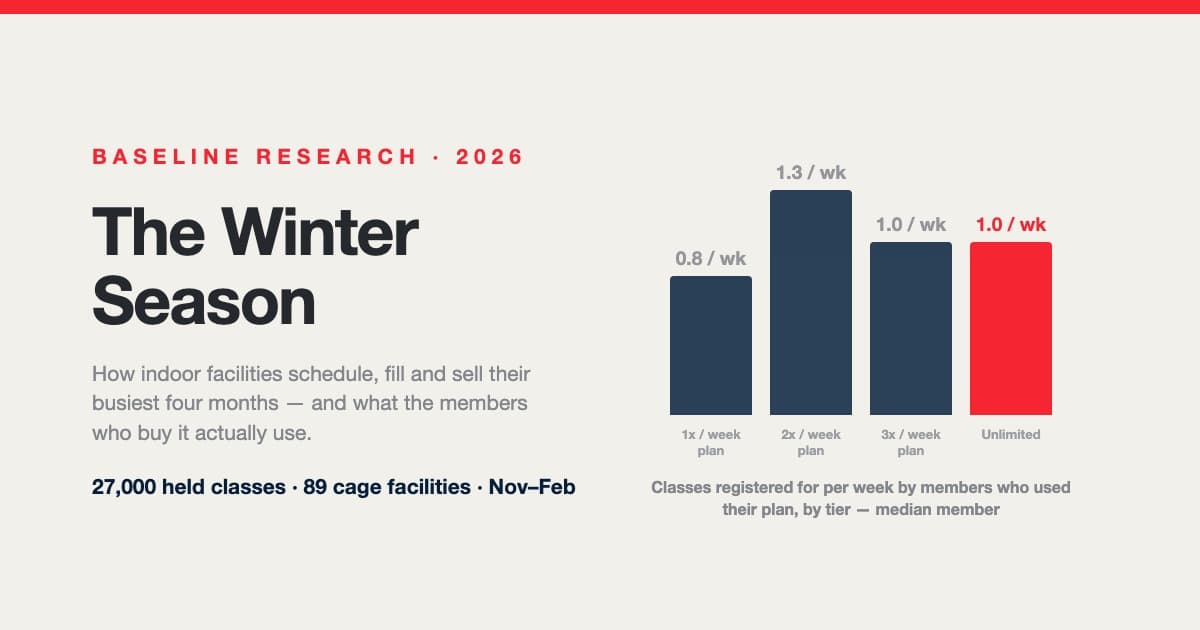
The Winter Season: How Indoor Facilities Schedule, Fill and Sell Their Busiest Four Months
Winter is the season an indoor facility is built for, and every autumn operators rebuild the same schedule from instinct. Across 27,000 held classes at 89 cage-equipped facilities: pitching needs nearly as much room as hitting, the median class has three or four athletes, one hitting program in ten runs every prime hour, classes tie up two-thirds of the cages only at the busiest hour, “unlimited” members come about once a week — and the plan a family buys, not how often they come, decides when they leave.
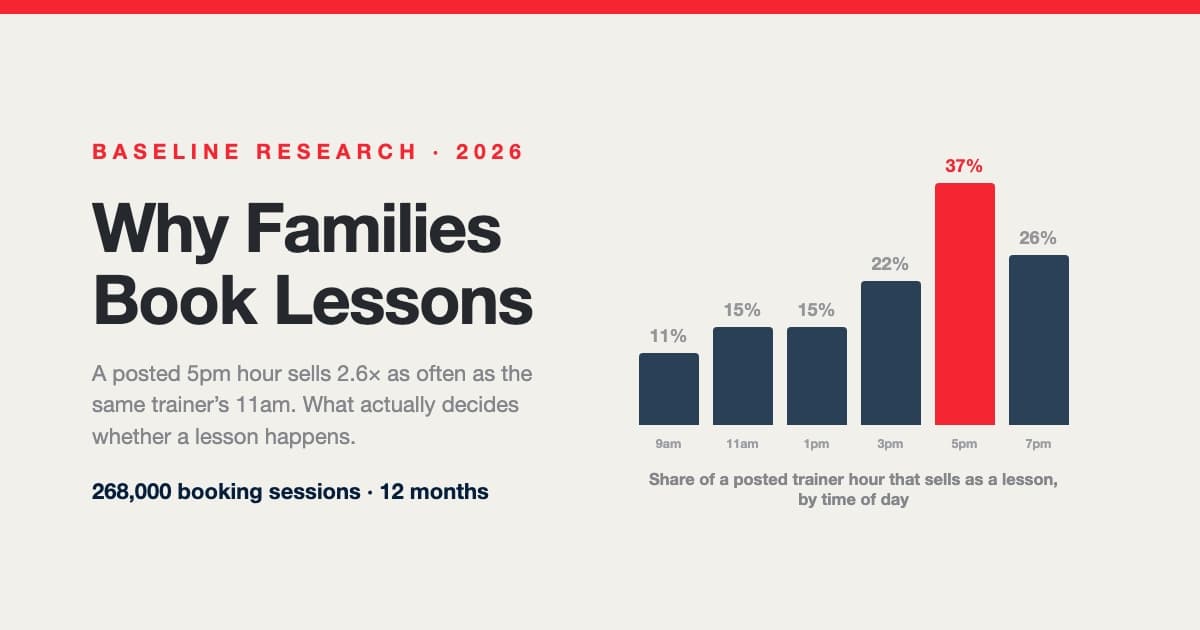
Why Families Book Lessons — and Why They Don't: A Year Inside 268,000 Booking Sessions
A posted 5pm hour sells nearly three times as often as the same trainer's 11am. Across 268,000 booking sessions, 29,812 families and 107,000 posted trainer shifts, what decides whether a lesson happens isn't price, sport or lesson length — it's which hours are on the calendar and how late families go looking. Including a measured answer to the question every operator asks: do 15-minute intervals actually win you bookings?
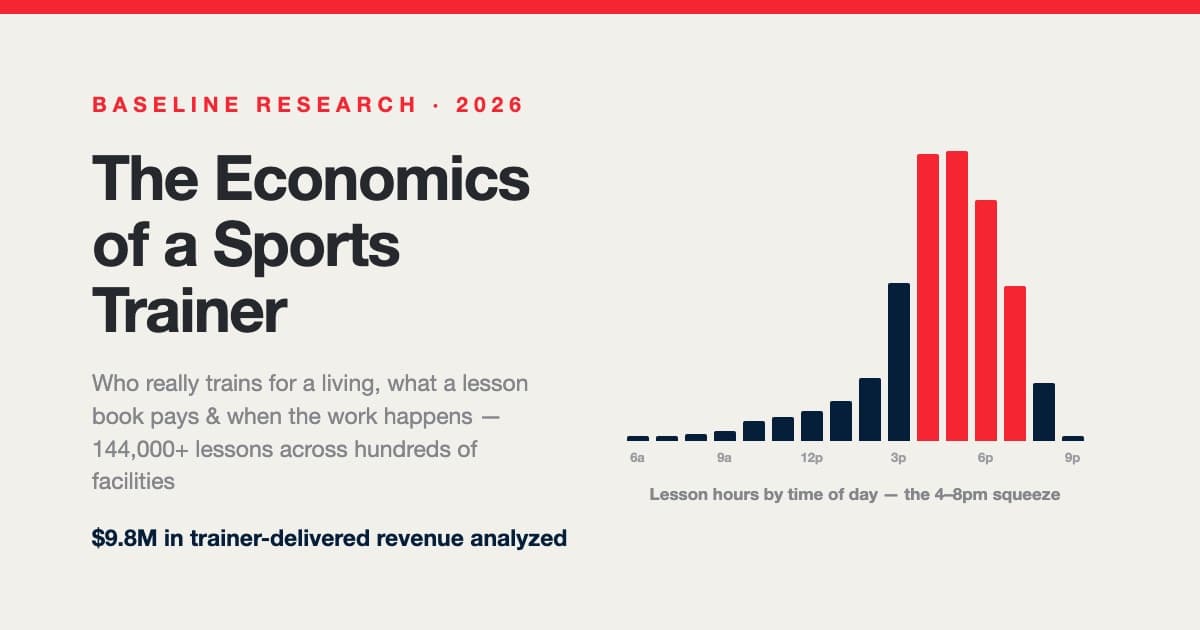
The Economics of a Sports Trainer: Who Trains for a Living, What a Lesson Book Pays, and Why the 4–8pm Wall Decides Everything
Inside a research cohort of training facilities: the full-time lesson trainer is nearly mythical (median 3.3 delivered hrs/week; 4.4% sustain 15+), the trainer split is a spectrum anchored at 50% and 60% that realizes near 47%, lessons run ~$104/hour in every discipline but strength, the median client book is 8 actives on a 90-day clock, and continuing books swing from −61% to +192% in a year — the numbers behind hiring, comp design, and the dependence ledger.