
The Winter Season: How Indoor Facilities Schedule, Fill and Sell Their Busiest Four Months
Winter is the season an indoor facility is built for, and every autumn operators rebuild the same schedule from instinct. Across 27,000 held classes at 89 cage-equipped facilities: pitching needs nearly as much room as hitting, the median class has three or four athletes, one hitting program in ten runs every prime hour, classes tie up two-thirds of the cages only at the busiest hour, “unlimited” members come about once a week — and the plan a family buys, not how often they come, decides when they leave.
Winter is the season an indoor facility is built for, and every autumn operators rebuild the same schedule from instinct: how many nights to run, which skills get the cages, how big a class should be, what to charge, whether to sell an unlimited tier — and how much of it the families who sign up will actually use. We went looking for the answers in last winter’s calendars: 27,677 held group-training classes and 140,788 class registrations at 89 cage-equipped businesses from November through February, joined to the memberships that paid for them. Nearly every widely-held belief about the winter schedule turns out to be directionally right and quantitatively wrong.
About this study — and who's in it
Where this sits in our research
Seven findings that should change how you build the season
- Pitching needs nearly as much room as hitting. At the 56 businesses running both, pitching classes are 0.9× as numerous as hitting classes (median business) and consume about 97% as many class space-hours pooled across those businesses. 45% of them hold at least as many pitching classes as hitting classes. Protecting hitting space at pitching’s expense is the wrong instinct for most programs.
- The “every hour of prime time” schedule is rare. The median hitting program has a hitting class running in 4 of the 25 weeknight prime hours; about 10% of hitting programs cover every hour from 4 to 9pm on even one weeknight in a typical week, and 18% manage it in at least one week of the winter. Programs of any kind have a class running in 9 of those 25 hours, on 4 of the five nights.
- Six-to-one is a cap, not an average. The median business’s median held hitting class has 3.5 athletes and 3 per coach. Pooled over every hitting class, 17% exceed 6:1 — but at the median business almost none do (1.8%). Facilities set hitting capacity around 9 and fill 58% of it.
- Classes take two-thirds of the cages at the busy hour — and one cage the rest of the time. A typical weekday prime hour has 1 class running; a busy one (the 90th percentile) has 2 classes tagged to 3 cages in a four-to-eight-cage building — 69% of them, because classes are usually spread across several cages. At the single busiest hour of the winter that rises to 85%.
- One posted class in seven runs empty, and it is a programming choice more than an hour. 15% of posted classes at the median business had nobody on the roster. Hitting classes fill at every hour of the evening (5% empty at 6pm, 9% at 8pm); the empties concentrate in 8pm slots of other programming — a third of posted 8pm classes at the 26 businesses that post them.
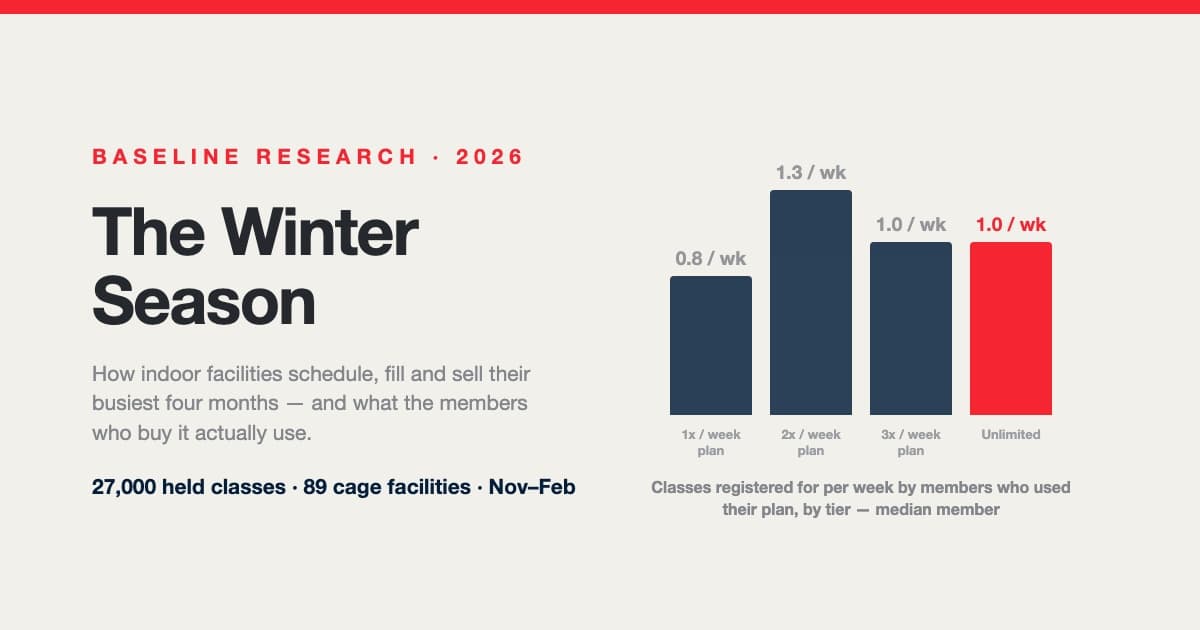
- “Unlimited” members come about once a week. Among members who used their plan at all, the median member on an unlimited plan (classes included, nothing consumed) registered for 1.0 classes a week — a 2×-a-week member registered for 1.3, a 1×-a-week member for 0.8. At the typical business only 17% of unlimited users exceeded two classes a week.
- The season runs 18 weeks, and so does the customer. The median program is at winter pace from the week of November 3 through the week of February 23, peaking the week of January 5. Of paying members who joined a class plan in October–December, 42% had canceled by March 1. Which plan they bought — not how often they came — is what moves that.
Part 1: What a winter class program actually looks like
Start with the calendar. In a typical operating week of the winter core the median cohort business posted 13 class slots and held 11 (a “held” class has at least one athlete on the roster), drawing 47 registrations a week. Counting dark weeks — 45 of 89 businesses had at least one week with no class, mostly Thanksgiving and Christmas — the calendar-week median is 9. The spread is enormous: the 25th-percentile program holds 6 classes a week, the 90th percentile 49. Programs run on 4 of the five weeknights at the median; 11% of classes land on Friday and 13% on the weekend — this is a Monday-through-Thursday business.
Every skill peaks in the same hour. 6pm is the modal hitting start (26% of hitting classes) and the modal pitching start (24%); 5, 6 and 7pm together carry roughly 57% of all hitting classes. This is the same wall the rest of the series keeps hitting. Private lessons sell 3.3× as much of a posted 4–8pm hour as a midday one; 62.5% of all trainer-delivered lesson hours land in that window; the facility study found Tuesday 6–7pm the single busiest hour of the industry’s week. Group classes do not escape the after-school compression — they are simply the highest-yield way to sell inside it.
One difference worth naming, because it looks like a contradiction and isn’t: the facility study defines prime time as weeknights plus weekend mornings, and weekend mornings are a real block of facility demand. Classes barely use them — 13% of held classes are on a weekend. The weekend morning is where rentals, teams and events live; the class program is a weeknight product.
The most ambitious version of a winter schedule — a class in every prime hour, five nights a week, with a second skill running alongside — is a real archetype, and it is a top-decile one. Running hitting every hour from 4 to 9pm on a weeknight means five hitting hours that night, 25 across the week. The median hitting program has hitting running in 4 of them (75th percentile 7, 90th 15). About 10% of hitting programs have even one weeknight where hitting runs every hour from 4 through 9 in a typical week — 18% do it in at least one week of the winter. Stacking a second skill into the same hour is rarer still: among the 56 businesses that run both hitting and pitching, the median week has 0 such hours and 52% never do it at all — they put pitching on its own night or its own hour. None of that makes the ambitious schedule wrong. It makes it a plan that has to survive the class-size and fill numbers below from day one.
What the busiest programs look like
Part 2: How much space each skill actually takes
The most common space worry in a cage building is that hitting will get crowded out. The data says the skill to watch is pitching. 56 cohort businesses (63%) run both hitting and pitching classes. At the median one, pitching classes are 0.9× as numerous as hitting classes (25th–75th percentile 0.5–1.5×), and 45% of them hold at least as many pitching classes as hitting classes. Pooled across those businesses, pitching classes consume 97% as many class space-hours as hitting; within the median business the ratio is 0.9×. Pitching classes are smaller (below), so they carry 0.7× the registrations of hitting — but a class occupies a cage whether it has three athletes or six.
Among businesses that run the skill, hitting takes 33% of class space-hours at the median and pitching 26% — roughly a third and a quarter, with the same ordering in prime time. Strength and speed work is the other big consumer (27% of prime class hours where offered), but 72% of it happens in weight and training rooms, not cages. Catching and fielding classes are real but small lines — under a tenth of class hours where they exist.
This is the practical version of the finding. Pooled across all pitching-class hours, roughly 46% happen on dedicated tunnels or mounds and 34% in batting cages, with 11% on open turf — and business by business it is a coin flip: 21 programs run pitching mostly in cages, 17 mostly on tunnels or mounds. A cage is a pitching lane if you point it the other way. Facilities that run both skills are not choosing between them cage by cage — they are running pitching in the same rooms, mostly at different hours.
How many cages classes tie up at once
Two facts have to be held together here. First, most of the time classes are a small tenant: at the median tagged business a typical prime hour has 1 class running. Second, when classes are busy they spread out: a busy hour (90th percentile) has 2 classes running, but because 61% of held classes are tagged to more than one space, those two classes sit on 3 cages — 57% of the median facility’s cages, 69% in the four-to-eight-cage band, and 85% at the winter’s single busiest hour. Classes are the anchor tenant of prime time — at the median business they account for 54% of prime space-hours booked to classes, lessons and rentals (12% lessons, 4% rentals), or 39% once team practices and admin blocks are counted as occupiers. That is the group-format shift the facility study identified as the difference between the busiest and quietest quartiles, measured from the inside.
Running two skills in every prime hour, five nights a week, would put a program in the top decile of the cohort. Its peers run one class in a typical prime hour and two — spread across about three cages — at their busiest.
Part 3: How big a class really is — the 6:1 question
Coach-to-athlete ratio is the number operators advertise and the one they most often overestimate. Facility websites in this market publish caps from 3:1 to 8:1; 6:1 is a common promise. Here is what actually shows up on the roster:
The median business’s median hitting class has 3.5 athletes; pitching 4.0, catching 3.3, fielding 4.0, strength 3.0. Pooled across every held hitting class, the median is 4 and the 90th percentile 10; because big classes hold more athletes, the class the average athlete sits in has about 8.3 kids in it. About one hitting class in eight ran with a single athlete at the median business (12%) — real class slots that drew one sign-up, not mislabeled private lessons. Facilities set hitting capacity at a median 8.7 and pitching at 9.0, and fill 58% and 58% of it; 14% of hitting classes sell out. One caveat on “capacity”: the platform defaults a class to 10 when the field is left blank, and 14% of held classes sit at exactly 10 — fill excluding those is 52% against 48% overall.
A 6:1 class sits at the top of the market, not the middle. 71% of hitting classes run at four athletes per coach or fewer; 17% run above six and 8% above eight — and those oversize classes are concentrated in a few large programs, so at the median business fewer than one hitting class in fifty exceeds 6:1 (1.8%). Pitching runs 20% above 6:1 pooled, with a median of 4 per coach. That matches what facility websites advertise — pitching groups capped at three to five, hitting at four to eight — and what the coaching guidance implies: two active athletes per cage or station with eight-to-twelve-minute rotations, so a 6:1 hitting class needs three stations per coach. The binding constraint on a 6:1 class is cages per coach, not coaches per athlete.
How to read 6:1 against these numbers
Which hours fill and which go empty
Hitting fills best at 5 and 6pm (66% and 65%), and — against the intuition — holds up at 8pm (63%, a small cell of 15 businesses); pitching is flatter and softer late. The empty-slot curve is the sharper signal, and it is about what gets posted late as much as when: at the median business a posted 5pm class runs empty 10% of the time, 7pm 17%, and 8pm 33% — but hitting classes specifically run empty only 9% of the time at 8pm. The late empties are mostly strength, speed and other group programming posted into a slot families don’t take.
Where “post more inventory” stops working
Part 4: Youth and high school want different hours
About half of held classes (50%) carry some age wording in their name — a “12U”, a “HS”, an “ages 9–12” — but only 39% name a single band; one class in five is labeled with a range that spans bands (13U–18U, MS/HS). 63% of businesses label at least a fifth of their classes, 30% run both an unambiguous youth and an unambiguous high-school track, and 60% run a youth track plus some older class. Among labeled classes, 30% are youth (12U and under), 17% middle school, 28% high school and 22% mixed-age. The two clean tracks do not want the same hours:
- Youth classes bunch at 5 and 6pm — 54% of youth classes start in those two hours, 35% before 5pm and only 11% at 7pm or later. Parents are driving, dinner is at seven.
- High-school classes are spread evenly across the evening. Roughly 20%, 12%, 16%, 16% and 17% of high-school classes start at 4, 5, 6, 7 and 8pm — with 34% at 7pm or later against 11% for youth. Within the 22 businesses running both tracks, high school is the later track at 59% of them — a tendency, not a rule. That 7–9pm block is the one part of the evening a youth-only schedule leaves on the table.
- Class size does not differ by age. Youth and high-school classes both run at a median 4–3 athletes with similar fill; an earlier cut of this data suggested middle-school classes were bigger and fuller, and that turned out to be one business’s program, so we don’t publish it.
Part 5: When winter starts, dips and ends
The season has a shape everyone recognizes and almost nobody schedules around. It arrives in two steps: registrations sit near half their winter level from late September through October (44–60), jump to 81 in the first week of November and reach the winter norm the week of November 10. They drop by a third at Thanksgiving (67) and by half at Christmas (50), come back stronger than before the holidays, peak the week of January 5 (113), hold through February, then step down: 86 the last week of February, 69 and 63 in early March, 44 by mid-March as tryouts and spring practice take the athletes back. Per business, the median program is at 80% or more of its winter pace from the week of November 3 to the week of February 23 — 18 weeks, with a quarter of programs running 15 weeks or fewer and a quarter 22 or more.
Two things the median hides. The spread in October is the whole range: a quarter of businesses are already at winter pace (85 at the 75th percentile) while 19 of 89 had not held a class yet. And the grey line: facilities post October classes at about three quarters of their winter volume while registrations run at half — October classes run half-empty because the season hasn’t started for the families yet, and the same gap reopens in March.
Classes are a winter product in a way the rest of the business is not. On the winter scale the median business runs at 102–110 in December and January, 61 in March, and 29–19 in April and May; among the 43 businesses on the platform for the full summer, the winter core held 2.3× as many classes as June–August. That is a far sharper swing than the building as a whole: the facility study found total revenue at a diversified facility moving only about ±30% across the year, with November through February delivering roughly 38% of it, and membership revenue flatter still at ±18%. The class program is one of the things making winter feel like winter. It is also stable year to year — among the 36 businesses with a comparable 2024–25 winter, held classes ran 1.0× the prior winter’s at the median.
Season playbook
Part 6: How classes are sold — memberships, packs, credits or cash
Tiered class memberships are one of several ways cohort facilities sell the same hour of coaching, and they are not the most common one by business count. Reading the price rule on every held class in the fresh winter data:
38% of cohort businesses sell most of their classes pay-per-class — a median $40 a seat for a drop-in class (25th–75th percentile $30–$50; multi-week series list a whole-program price, median $240). 27% include most classes in a membership, 12% require a prepaid class pack (units that come from a membership’s included packs or a purchased pack), 14% price them in credits, and 7% run them free (member perks, team sessions). Because membership programs are bigger, the picture flips when you count classes instead of businesses: 42% of held classes are membership-included and only 21% are true drop-ins. Hitting is the most cash-priced skill (47% of hitting programs mostly pay-per-class); pitching programs are more evenly split (34% mostly included, 44% mostly cash).
The 1× / 2× / unlimited ladder, and what it mechanically is
67 cohort businesses sell memberships whose members register for classes (301 plans; 228 of them “dedicated” plans where at least half the members take classes, the rest broader memberships with classes as a perk). Sorting each plan by what it mechanically grants: 82 are unlimited plans in the true sense — the classes list the plan as included and nothing is consumed per class; 59 are general memberships (open cage, discounts) whose members buy classes separately; and the capped tiers run 31 at about four class units a month, 38 at about eight, 29 at about twelve and 38 at fifteen or more, with 24 low-credit plans granting under three. The ladders are simpler than the marketing suggests: 13 businesses sell only included-unlimited class plans, 15 only general memberships, 35 sell at least one frequency-capped tier, and 17 sell two or more capped tiers — the classic 1×/2× ladder is roughly a one-in-four structure.
What a “1× a week” tier is, mechanically, matters for the member-behavior numbers below. On this platform there is no per-week attendance cap anywhere — we verified this against the application source. A 1×-a-week plan is a pool of credits (typically four) added every billing cycle to one wallet, or a prepaid pack of four class units issued each cycle; registration only checks that the wallet covers the class. Unused credits roll over by default unless the facility turns on a reset. A member can use all four in one week — and 46 of the capped plans are also listed as “free for members” on some classes, where the cap doesn’t apply at all. “Unlimited” plans, by contrast, are simply listed on each class; nothing is consumed, and the only caps are the class capacity and the waitlist. So the tiers are pricing devices, not scheduling devices; the schedule is enforced by what is posted and what fills.
Prices step up through the capped tiers — median $200 a month for 1× a week, $250 for 2×, $360 for 3× and $374 for 4× or more (all small cells) — and the true unlimited tier comes in at $175, between the 1× and 2× tiers. Where a business sells both a 1× and a 2× tier, the 2× costs about 1.3× the 1× (5 businesses). Facility websites in the wider market price the second weekly class at 1.5–2.0× the first on the pages we could verify, and days three and four as cheap increments; in this cohort the cells are too small to publish a full ladder, and the honest summary is that the second class per week is the expensive step and everything after it is cheap — including “unlimited”.
Worth noting where these sit in the wider membership market. Our memberships study put the median listed recurring plan at $180 a month and the median active member at $100. Class tiers price above both: the capped tiers run $200–$374 and even the unlimited-included tier sits at $175. Coached group time is the premium end of the membership shelf, which is exactly why the retention numbers in Part 8 matter so much.
Part 7: What members on each tier actually do
This is the part no website tells you. We joined every winter class roster to the membership of the athlete on it (crediting a parent’s or sibling’s account where the family booked that way) and counted class registrations per active week, November through February, for 7,030 athletes on class plans at cohort businesses. Two lenses: every member on the plan, and the members who used it at all.
- 1×-a-week members use most of their allotment. Median 0.8 classes a week among users — roughly three a month against a four-a-month grant (79% of cap at the median). Only 35% average a full class every week — the pool lets them skip.
- 2×-a-week members are the most engaged. Median 1.3 a week, 65% at one-plus a week, using 69% of their eight-credit month. They bought two and come one-and-a-third times.
- Unlimited members behave like members between the 1× and 2× tiers. Median 1.0 a week; 50% at one-plus; 26% above two a week pooled — 17% at the typical business — and 13% above three. The typical unlimited member would fit inside a 2× plan; the word “unlimited” is buying the option, and a minority exercise it. This is the fitness-industry result — DellaVigna and Malmendier’s flat-fee gym members averaged 4.3 visits a month — showing up in cages. One caveat: the handful of plans literally marketed as “Unlimited” (15 plans, 72 users at 9 businesses) draw heavier users — about 1.9 a week at the median such business — so a program that sells the word should expect to deliver on it.
- 3×-a-week members don’t come three times. Median 1.0 a week pooled (1.3 at the median business), 34% of cap; 24% do exceed two a week — the tier selects the committed athlete and then under-delivers on the third day.
The second lens is harsher. Counting every member on a dedicated class plan — the plans where classes are the product — 28% never registered for a single class all winter, and the median member registered 0.5 times a week. Define class plans without looking at attendance at all (plans a class lists as included, or plans named for classes) and the never-registered share rises to 42%. Some of that is a join limit — a family account we couldn’t link, an athlete added to a class by staff under a different record — but the shape survives every cut we made: the winter class business runs on a core of once-to-twice-a-week regulars, a tail of three-plus-a-week athletes, and a large group who paid and stopped coming, or never started.
Part 8: The seasonal buyer — who stays, who leaves, and when
We followed the 1,045 paying members who joined a non-seasonal class plan at a cohort business between October 1 and December 31, 2025 — the winter sign-ups — through early September. (Another 329 winter “joiners” were $0 roster rows — team perks and admin-created records — that almost never cancel; they are excluded, and the numbers change materially if they aren’t.) Retention is 76% at 60 days, 63% at 90 and 42% at 180; 42% had canceled by March 1 and 57% by May 1. Some cancellations are plan swaps — 17% are followed by a new membership at the same business within weeks — and counting those as retained lifts the 90-day figure to 72%.
The plan predicts the exit. Joiners on dedicated class plans retained 55% at 90 days and 33% at 180; joiners on broader memberships with classes as a perk retained 84% and 67%. By tier, the included-unlimited plans retained 69% at 90 days (19 businesses), the 1×-a-week plans 55% (10) and the 2×-a-week plans 38% (10; consistent across its businesses, and the most expensive capped tier — a price-and-commitment story more than a frequency one).
A correction to something we published before
The same distinction resolves a second apparent conflict. The memberships study found usage decay driving preventable churn — members stop coming, then cancel — and that remains the right model for an access membership. It is not the model here. In the pooled data the members who registered for the most classes were the most likely to be gone by spring: heavy users (a class a week or more) retained 58% at 90 days against 79% for light users. But that gradient does not exist inside a business. Comparing heavy and light users at the same business, in the 11 businesses with enough of both, heavy users were no more likely to cancel (odds ratio 0.9, retention worse for heavy users in 7 businesses and better in 4). The pooled gap is composition: heavy users cluster in dedicated class programs at businesses whose winter season ends in February, and light users cluster in year-round memberships. How often a member came is not what predicts the exit. What they bought, and when the season ends, is.
The stated reasons are the seasonal story in the members’ own words: a sport season starting or another sport, back to school or college, a switched plan, a schedule that stopped working. Price is 2% of stated reasons and “not using it” 3% — the same shape the memberships study found platform-wide, where only 0.6% of cancellations cite price. And the calendar confirms the rest: 47% of the year’s cancellations land in January, February and March. Design for the exit — a winter class member is a customer you will re-sell in October, not one you will keep.
Part 9: The peer table — one to three, four to eight, nine-plus cages
| Median business, winter core | 1–3 cages (n=21) | 4–8 cages (n=37) | 9+ cages (n=31) |
|---|---|---|---|
| Leaf cages / tunnels | 2 | 6 | 13 |
| Classes held per operating week | 11 | 8 | 15 |
| Class registrations per week | 42 | 40 | 64 |
| Distinct athletes in classes (Sep–Mar) | 82 | 118 | 175 |
| Skills run (of hitting, pitching, catching, fielding, strength) | 3 | 3 | 3 |
| Pitching share of held classes* | 5% | 21% | 23% |
| Hitting share of held classes* | 32% | 31% | 22% |
| Weeknight prime hours with a class running (of 25) | 8 | 8 | 12 |
| Athletes per held class | 3 | 4 | 4 |
| Capacity set per class | 10 | 10 | 12 |
| Fill (roster ÷ capacity) | 49% | 52% | 44% |
| Classes’ share of prime space-hours booked to classes, lessons and rentals | 77% | 54% | 41% |
*Skill shares are medians over all businesses in the band, including those that don’t run the skill: 24% of four-to-eight-cage businesses hold no pitching classes and 5% no hitting classes, so these cells describe the band, not the typical pitching or hitting program.
The four-to-eight-cage peer — the most common shape in the cohort — holds 8 classes an operating week at the median (75th percentile 17) for 40 registrations, runs 3 skills and has a class running in 8 of the 25 weeknight prime hours. Notice what does not change with size: class size (3 athletes in every band), capacity (10) and fill (~52%) are the same in a two-cage shop and a fifteen-cage complex. Bigger buildings run more classes, not bigger ones. The small-cage band is the exception on density — 5.3 classes per cage per week against 1.4 in the four-to-eight band — because with two cages, classes are the building.
The winter playbook: ten moves, ranked by leverage
| # | Move | The number behind it |
|---|---|---|
| 1 | Give pitching its own cage at 5 and 6pm, every night you run it | Pitching classes are 0.9× as numerous as hitting and take ~97% as much class space-time; 21 of 47 pitching programs already run mostly in batting cages |
| 2 | Sell 5, 6 and 7pm hitting plus a late high-school block — not filler every hour to 9 | 6pm is the modal start (26% of hitting classes); hitting fills 63% even at 8pm, but posted 8pm classes of other kinds run empty 33% of the time |
| 3 | Cap at 6, staff for 6, budget on 3–4 | Median hitting class 3.5 athletes, 3 per coach; 17% of hitting classes exceed 6:1 pooled, almost none at the median business; fill 58% of capacity |
| 4 | Split youth and high school by clock, not just by name | Youth: 54% of classes at 5–7pm, 11% at 7pm+; high school spread evenly 4–9pm with 34% at 7pm+ |
| 5 | Price the 2× tier as the flagship and treat unlimited as a 2× plan with an option attached | Unlimited users register 1.0/wk median vs 2× users 1.3; 17% of unlimited users at the typical business exceed 2/wk |
| 6 | Make “1× a week” a monthly pool on purpose — and decide whether credits roll over | No per-week cap exists on the platform; 1× users hit 79% of their monthly grant, 2× users 69%, 3× users 34% |
| 7 | Open the first week of November, close the last week of February; sell March as pre-season | Registrations hit 100 the week of Nov 10 and 44 by Mar 16; the median program is at winter pace for 18 weeks; October classes run at half of winter registrations while posted at three quarters |
| 8 | Build the spring conversion before the winter starts | Paying winter joiners: 57% canceled by May 1; dedicated-plan joiners retain 33% at six months; 47% of cancellations land Jan–Mar |
| 9 | Post hitting late, not everything late | Hitting classes run empty 9% of the time at 8pm; all posted 8pm classes 33% at the median business posting them |
| 10 | Chase the members who stopped coming in December | 28% of members on dedicated class plans never registered for a winter class (42% under a stricter definition); “not using it” is only 3% of stated cancel reasons because they leave without saying so |
The through-line: a winter class program is a seasonal product sold into a five-hour window on four nights, and the peer group runs it at three or four athletes per class, one class at a time in a typical hour and two at its busiest, with pitching taking nearly as much room as hitting. Baseline’s scheduling handles the repeat-weekly class rail, capacity and waitlists, and its memberships carry the credit pools and included-class tiers described here; the reporting tools show the fill-by-hour and registrations-by-member views this study was built from. See it live.
Methodology
Data. Aggregated, anonymized operational data from youth sports businesses on Baseline: every group-training class on the calendar from late September 2025 through March 2026 (a fresh pull on September 3, 2026 carrying class prices, membership inclusions, rosters and waitlists), the platform’s full event history through August 2026 for seasonality and the prior winter, the membership plan and member tables (snapshot September 3, 2026), the space catalog, household links, and skill categories. Membership mechanics — how credits are granted, pooled and spent, what an “unlimited” or “members-only” class is, how repeat classes are created, what check-in and roster edits mean — were verified against the application’s source rather than inferred from data. Every finding was then re-derived by an independent adversarial pass (twelve verifiers, each attacking one method or claim); the corrections it forced are reflected throughout, and the ones that changed a headline are noted in the text.
- Cohort. Businesses with at least one leaf-level batting cage or tunnel in their space catalog and at least 40 held classes in the winter core (Nov 1 2025 – Feb 28 2026): 89 of the 203 businesses that ran any winter class, holding 95% of all winter classes and 95% of registrations. 61 are baseball-skill programs (hitting, pitching, catching or fielding classes are at least half of what they hold); the remainder are strength-only or mixed group-training programs in cage buildings, and their headline cells (class size 3, fill 54% for baseball programs alone) do not differ. Test and demo accounts excluded. The cohort is program-runners by construction, and per-week volumes are floor-dependent: at a floor of 25 held classes the median program holds 8 classes a week, at 60 it holds 15.
- Classes. Calendar events of type “event” or “series”, 20–240 minutes, with a posted capacity of 3 to 40 (capacity-1 and capacity-2 slots are semi-private lessons and are excluded; a blank capacity is admitted when three or more athletes registered), excluding camps, clinics, tryouts, tournaments, leagues, parties and practices by name and category. Sessions with a capacity above 40 (5% of registrations) are large-format or sentinel-capacity sessions and are excluded. Held = at least one athlete on the roster; posted = every member-visible, non-canceled slot (hidden and enrollment-driven rows excluded from the posted denominator). Skill is read from the facility’s own skill category on the class, falling back to the class name, through a keyword map that was audited against a census of category names and a sample of class names; about 6% of classes move bucket under the corrected map, and the “other” bucket (12% of held classes) is roughly a third unlabelled baseball or softball group training, a quarter fitness classes and a tenth other sports. Age band is parsed from class names (12U-style tokens, “youth”, “HS”, “varsity”, grade and age ranges; ranges spanning bands are “mixed”); unlabeled and mixed classes are excluded from age charts only.
- Space. Space-hours = duration × spaces tagged on the class; space-allocation figures use businesses tagging spaces on 70%+ of held classes, and a one-space-per-class sensitivity is reported because 61% of tagged classes list more than one space. Cages are counted at the leaf level of each facility’s catalog (a space listed as another space’s parent is not counted), in the manner of the facility economics study. Concurrency = held classes overlapping the same weekday 4–9pm clock hour; the cage share counts the distinct cages those classes tag. Prime = Mon–Fri 4–9pm in the facility’s time zone; weekly-grid figures count a class in every hour it overlaps, and the start-hour alternative is given in footnotes.
- Rosters, registrations and attendance. Class size and member usage use the roster at snapshot — the platform removes withdrawn athletes and retains staff additions, so it is the final list of registrations, and we say “registered” rather than “attended”. Hidden (unlisted) classes — — of held classes at the median business, typically team or internal sessions with larger rosters — count as held but not as posted inventory; excluding them entirely leaves the median class size at 3 and lowers the upper tail. Check-in is a manual staff action used by only 7 cohort businesses; where used, 93% of rostered athletes were checked in on classes with any check-in and 78% across all of those businesses’ classes, so roster is a modest upper bound on bodies in the cage. Walk-ins and off-platform sign-ups are invisible.
- Tiers and usage. A plan’s tier is computed from its own grant per 30 days (credits per cycle and prepaid class-pack units, normalized to the credit cycle): under 3 → low-credit, 3–5.5 → 1×/week, 5.5–9.5 → 2×, 9.5–15 → 3×, 15+ → 4×+; plans with no grant are “unlimited (included)” when a winter class lists them as included and “general membership” otherwise. Plan names were used only as a cross-check. “Class plans” are plans where at least a quarter of winter-active members registered for a class (301 plans at 67 businesses; “dedicated” = half or more); the never-registered share is also reported under an attendance-independent definition. Usage joins the athlete on each roster to a membership at the same business, credits a parent’s or sibling’s account where it isn’t itself a membership, de-duplicates members to one row per athlete, and scores members active at least four winter weeks. Pooled member distributions are published only where no single business holds 30% or more of the members; otherwise business medians are used.
- Retention. Winter joiners = memberships started Oct 1 – Dec 31 2025 on non-seasonal, non-commitment class plans (no fixed duration, season dates or program/annual billing cycle; per-class enrollment products excluded), followed to the September 3 snapshot; paying = a monthly amount or a transaction on record. Cancellation date is the platform’s effective end date. Cells where one business is half or more of the joiners are suppressed (the 3×-a-week tier). The usage–retention relationship was tested within business with a Mantel–Haenszel odds ratio and a paired comparison across businesses, which is why it is reported as composition rather than as an effect. Because these figures count every cancellation — not only the preventable ones — they are not directly comparable to the survival curves in the memberships study, which censor scheduled program endings.
- Anonymity. Every published figure aggregates at least five businesses; per-business distributions show the median only under eight businesses and quartiles only under twenty-five; pooled class-level distributions are reported as such and flagged where a few businesses dominate them. Cancel-reason buckets concentrated in one business’s vocabulary are folded into “other”. No business, trainer, family or athlete is identifiable.
- Limits. One platform, youth baseball and softball skewed, U.S.; one winter of fresh detail with one prior winter for comparison. Classes are scheduled by facilities, so what we observe is supply as much as demand — an hour with few classes may be an hour nobody wanted or an hour nobody offered. Tier cells are small (single-digit business counts for the 3× and 4×+ prices) and are labeled as such. External figures quoted in the text (camp ratios, the Little League coach-pitch ratio, flat-fee gym attendance, facility price ladders) were verified against their source pages on September 3, 2026.
Questions about the data, or want a cut we didn’t publish? Get in touch — we’re happy to run custom aggregates for press and researchers.
Baseline is the all-in-one operating system for sports facilities, clubs, and travel teams — scheduling, payments, programming, and team management in one platform.
Keep reading
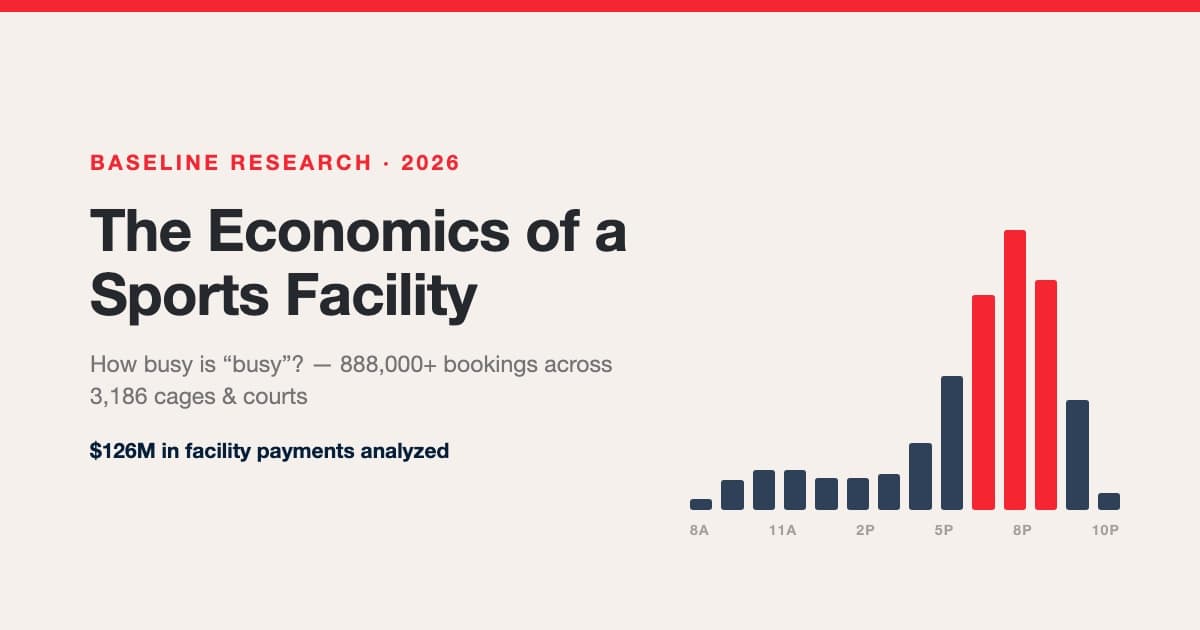
The Economics of a Sports Facility: How Busy Is Busy, What a Space-Hour Is Worth, and How the Packed Facilities Got That Way
We analyzed 888,000+ bookings, 863k space-hours, and $126M in payments across hundreds of sports facilities. Real utilization benchmarks (facilities are spiky, not empty — 2 in 3 sell out prime hours while averaging ~19% occupancy), rentals vs lessons vs group economics, the true lesson margin after trainer splits, credit-pack accounting, seasonality by category, and the occupancy ladder from quiet to packed.
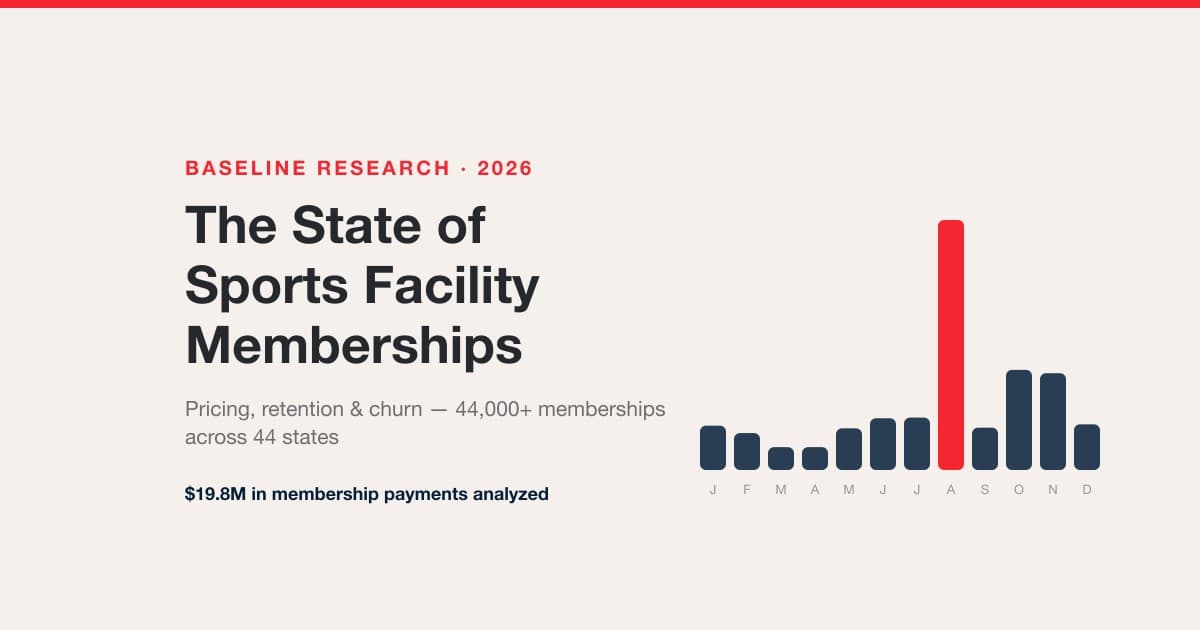
The State of Sports Facility Memberships: Pricing, Retention & Churn Across 44,000+ Memberships
We analyzed 44,000+ memberships and $19.8M in membership payments across hundreds of sports facilities in 44 states. What facilities charge by state, which membership styles retain, why annual billing doubles lifetime value, and the churn playbook the data supports.
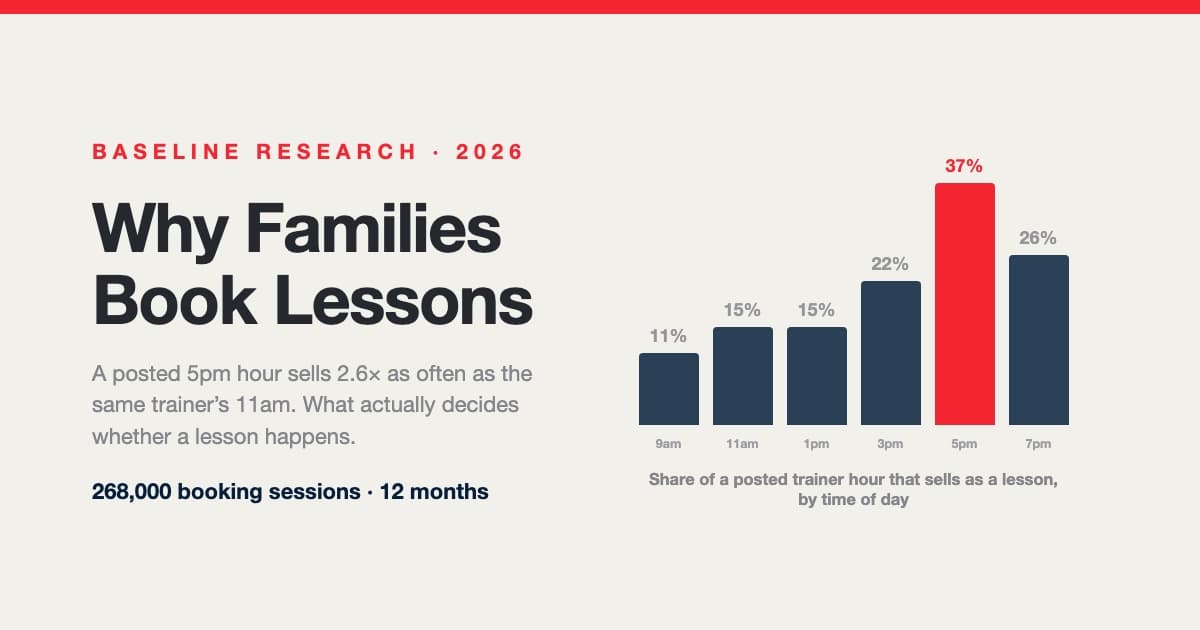
Why Families Book Lessons — and Why They Don't: A Year Inside 268,000 Booking Sessions
A posted 5pm hour sells nearly three times as often as the same trainer's 11am. Across 268,000 booking sessions, 29,812 families and 107,000 posted trainer shifts, what decides whether a lesson happens isn't price, sport or lesson length — it's which hours are on the calendar and how late families go looking. Including a measured answer to the question every operator asks: do 15-minute intervals actually win you bookings?