
The Economics of a Sports Trainer: Who Trains for a Living, What a Lesson Book Pays, and Why the 4–8pm Wall Decides Everything
Inside a research cohort of training facilities: the full-time lesson trainer is nearly mythical (median 3.3 delivered hrs/week; 4.4% sustain 15+), the trainer split is a spectrum anchored at 50% and 60% that realizes near 47%, lessons run ~$104/hour in every discipline but strength, the median client book is 8 actives on a 90-day clock, and continuing books swing from −61% to +192% in a year — the numbers behind hiring, comp design, and the dependence ledger.
The full-time private sports trainer is nearly mythical. Across a research cohort of training businesses on one platform — with the longitudinal analyses restricted to facilities carrying multi-year operating history, and no claim to represent the wider market — the median lesson trainer delivers 3.3 on-the-floor hours a week in the months they’re working, the going revenue split pays 60% on paper while the median trainer’s realized share of what sessions collect is about 47%, a quarter of new clients never book a second lesson, and just 6 of the ~580 trainers whose pay the data can model grossed $50k+ from delivered training in a year. This report is the anatomy of the job your lesson business runs on.
About this study — and who's in it
The headline numbers
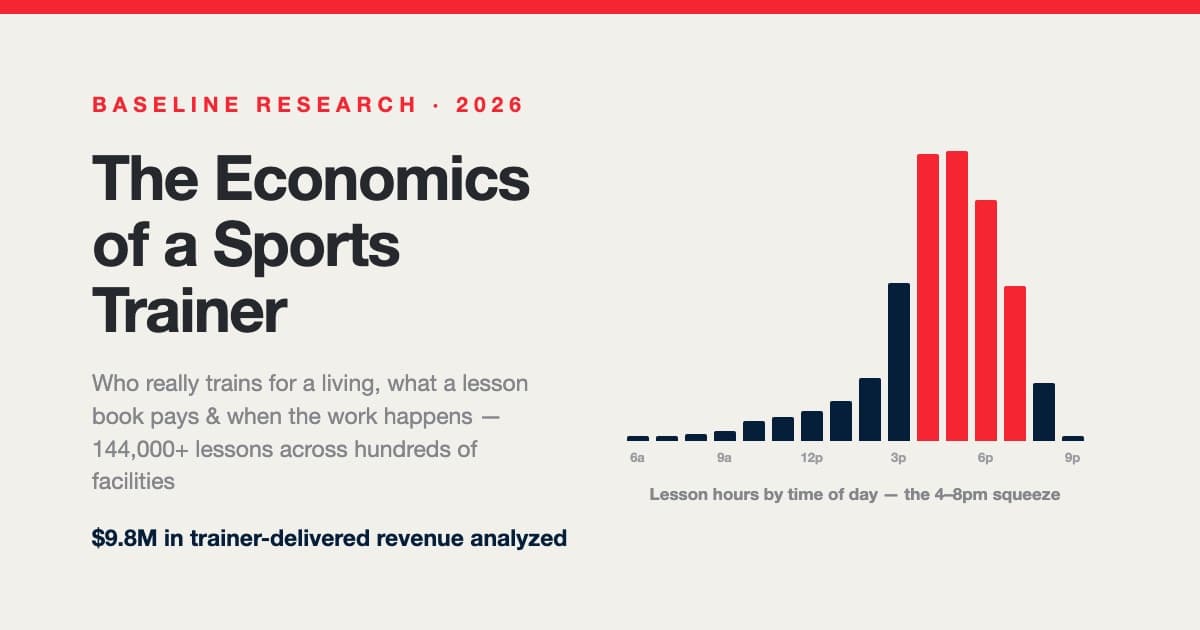
- 62.5% of lesson hours happen weekday 4–8pm. Clients are in school; a trainer's sellable week is ~20 prime hours. That's why only 4.4% of lesson trainers sustain 15+ hours a week — and why part-time isn't a failure state, it's the shape of the job.
- The split is a spectrum with two magnets. 50% and 60% anchor the rev-share market (tails run 40% to 100%+), while 58% of comp-configured trainers are hourly at a median $40/hr. Realized against everything sessions collect, the median trainer share lands near 47%.
- Lesson pricing is flat; hours are the only lever. $50/30min, $100/hour cards, $104/lesson-hour realized — hitting, pitching, catching, fielding all within a few dollars. The earnings ladder runs $4.8k → $43.8k by weekly hours (annualized at active-month pace — seasonal trainers take home less); a committed ~35-client book pays right at the U.S. coaching median wage.
- The client book runs on a 90-day clock. Median book: 8 actives a month, 1.5 lessons each. 26% of new clients never book lesson #2; the median trainer keeps 24% past 90 days; the top ten clients carry 79% of lesson revenue.
- Books are imported, then they swing. New trainers start at ~6.5 delivered hrs/month and don't ramp. From there, the season-adjusted swing within a single year is violent: among books that didn't go to zero, the median moved -5% but the spread runs -61% to +192.1% (p10–p90) — 17% of established books doubled while 13% got cut in half and 14% stopped entirely. Averages hide this; benches absorb it.
- Trainer dependence is a tail risk, not a universal. The top trainer's sessions carry a median 8% of a facility's total revenue — but 31% of facilities have 15%+ of ALL revenue riding on one trainer, and 32% of regular trainer–facility relationships end within a year even when the facility keeps running.
Part 1: The part-time truth — and the 4–8pm wall
First, a scope note: of the 1,400 active trainers in the cohort, facilities tag everyone who delivers sessions as a “trainer” — but only 42% mostly run 1-on-1 lesson books (587 trainers; the rest mostly deliver group programs, camps, and team practices). The classic trainer-economics questions live in that lesson group, so that’s who Parts 1–5 describe unless we say otherwise.
The median lesson trainer delivers 3.3 hours a week in their active months; the 90th percentile delivers 11.5. Just 4.4% average 15+ hours a week across their active months, and 0.3% average the 25-hour session load the fitness industry calls full-time. Even in their single busiest month, only 13.1% cross 15 hours a week.
Industry surveys say only ~28% of U.S. personal trainers work full-time. In youth sports the cap is structural, and you can see it in the clock:
Clients are in school until mid-afternoon, so a lesson trainer’s sellable inventory is roughly 20 weekday prime hours plus a thin weekend (10.2% of hours). A trainer can be excellent, in demand, and still capped. The season squeezes from the other side: the same trainer delivers about 2.2× the hours in January (index 122) as in July (56) — a winter income unless the facility engineers a summer product.
The two ways through the wall show up all over this cohort: group formats, which multiply what one prime hour yields, and daytime products — homeschool blocks, remote training, adult clients — that sell hours nobody else is bidding for.
Part 2: The split is a spectrum, not a number
Among active trainers whose facility configures compensation in-platform (49% of active trainers), two models split the market: 58% hourly (median $40/hr, IQR $25–$50) and 42% revenue share. And the revenue share itself isn’t one going rate — it’s a spectrum with two magnets:
Half the market clusters on the two focal deals — 50% (28% of rev-share trainers) and 60% (19%) — with a real tail above 70% and the true “sublet” (100%+, trainer rents the building) at just 1.4% of active trainers. External guides tell facilities to cap the trainer share at 50%; instructor-owned models run 70–80%; this market lives in between. Flip it to the house side and the stakes are obvious: at 50% the facility keeps half of every lesson dollar to cover the cage, the front desk, and the software; at 70% it keeps $30 of a $100 hour before costs.
Paper isn’t practice, though. Where facilities track actual payouts, the realized trainer share of everything those sessions collect spreads wide — median 47%, IQR 35%–61%, with 13% of tracked trainers under 30% and 13% above 70%. Two things drive the spread, and neither is anyone shorting anyone. About half the payout-tracked population is hourly-paid trainers, whose realized share sits below rev-share levels by design (a $40/hr wage on a ~$104 collected hour is a ~38% share). And for trainers on a configured percentage, realized share runs only ~5 points under their own paper split at the trainer level — with membership-included lessons, packages, and comped sessions the likely dilution. Either way, the house-side arithmetic reconciles cleanly with the facility study’s finding that the house nets about a rental’s worth from a lesson after the split.
Discipline barely moves price: hitting ($105/hr realized), pitching ($106), catching ($104), and fielding ($106) all land within a few dollars; only strength/conditioning sells cheaper (~$84/hr), priced like floor time rather than a private skill lesson. Specialty doesn’t command a premium: what separates the top quartile isn’t the discipline taught — top-quartile trainers overall realize $117+/hr regardless of discipline.
Lesson pricing across the country
Pricing power is local. We computed each facility’s median realized dollars per lesson-hour, then took the median across facilities in each state (states shown only where we have 5+ businesses that price enough lessons to measure). Read the map in dollars per hour of instruction, not per lesson — most facilities sell 30-minute lessons, so a $50 half-hour appears here as $100/hour.
The striking thing is how narrow the band is. The priciest state in our data (Illinois, $121/hour) is only about 1.5× the cheapest (Missouri, $80) — nothing like the spread you see in membership pricing, where the same cohort runs from $41 to $249 a month. Private instruction is priced close to a national norm of roughly $100 an hour, nudged by region: Northeast $107, West $100, South $94, Midwest $92.
Geography moves lesson pricing far less than it moves membership pricing, and the two don’t track each other: Michigan carries the highest membership prices in our memberships study but the cheapest lessons here; Georgia is the reverse. Membership pricing reflects what a local market will pay for access; lesson pricing looks like a trade norm — an hour of a skilled coach’s time costs about the same everywhere, so the lever that actually moves a lesson P&L is the split and the format, not the sticker.
Operator move: put the comp terms in the system
Part 3: What trainers actually earn
We model each trainer’s gross training pay from their facility’s configured terms — the revenue share applied to what their sessions collected, or the hourly rate applied to their delivered hours (plus a small remainder extrapolated from tracked payouts where no terms are configured) — cross-checked against $1958k of recorded payouts (the revenue-share arm of the model runs ~10% conservative; methodology below). Coverage: 582 of 1,400 active trainers (42%) — the majority without configured terms can’t be assessed at all.
The median modeled trainer grosses about $2.9k a year from delivered training — pocket money for a coach with a day job, which is what most trainers are. The distribution is long: p90 is $17.4k, about one in five modeled trainers cleared $10k, 5.8% cleared $25k, and 6 trainers — 1.0% — cleared $50k.
The arithmetic behind the ladder: at $104/lesson-hour and a ~47% realized share, a trainer nets roughly $50 per delivered hour — 5 weekly hours is a ~$13k/yr side income, 15 hours ~$40k, and a true 25-hour book would gross into the $60–70k range if the wall let you fill it. The 4.4% who average 15+ hours — and the 19 of them who hold that pace across six-plus months of the year, the committed book — run a median of ~36 active clients a month and gross a median $47.5k annualized (quartiles $31.3k–$64.6k). For scale: the U.S. median wage for coaches and scouts is $47,320. The committed trainers sit right on it — and the handful above it got there mostly on privates: year-round books of 15–24 weekly hours, not side hustles that scaled.
What these numbers do and don't count
Part 4: The client book — small, loyal, and on a 90-day clock
The median lesson trainer’s book is 8 active clients in a month (25 distinct across a year). A typical client books 1.5 lessons in a month they train — closer to every third week than weekly — and spends a median $96 a year with a given trainer. Books are top-heavy (79% of revenue from the top ten clients) and largely exclusive (only 21% of clients train with two or more trainers at the same facility in a year).
The brutal part is the clock. 26% of a typical trainer’s new clients never book a second lesson. The median trainer keeps just 24% of new clients past 90 days — pooled across all lesson relationships, 31% of new clients continue past 90 days, rising to 38% in fully-matured cohorts. Once a client clears the second-lesson hurdle, the median relationship runs 92 days — roughly a season — and the typical relationship at a top-quartile trainer lasts 148+ days.
This is the trainer-level version of the 90-day cliff we found in memberships — except in lessons the cliff comes even earlier: the second booking. The playbook answer is to remove decision points — rebooking before the athlete leaves the building, lesson-included memberships, prepaid packs with scheduled redemption — so continuing is the default rather than a re-decision, and documented development is the natural answer to the question every parent eventually asks: are these lessons working? A full-time book makes the math concrete: committed trainers hold ~36 actives against that churn — in this cohort they signed up 80-some new clients over the year, more than two full books’ worth of recruiting. Full-time training is a sales job with a swing plane.
Part 5: How books actually change — a distribution, not a destiny
The romantic story is a trainer who starts with two clients and compounds into a career. The data says books arrive, swing, and end. Start with the arrival: new trainers joining an established facility start at ~6.4 delivered hours a month — and the median is still there a year later. There is no organic ramp; the book a trainer can serve inside the 4–8pm window fills within weeks and holds.
Once established, the honest picture of a trainer’s year is a distribution, and it is wild. We took every established trainer at a facility that stayed active all year, season-adjusted their first-half-vs-second-half change (winter alone inflates raw “growth” by 26%), and bucketed the results:
Among the books that kept going, the median moved -5% — but the median is the least interesting number on that chart. A quarter fell 38%+ while a quarter grew 50%+; 17% doubled; 14% went to zero even though their facility kept operating. Individual books are volatile in both directions — which means a facility’s lesson line is a portfolio. Adding trainers is how the portfolio grows, and the swing is why a bench (not one packed book) is the stable configuration. Same-months year-over-year tells the identical story: among veterans, 21% grew, 27% shrank, and 34% wound down to zero at that facility within the year.
One star, a core, or a deep bench?
If a facility’s lesson revenue is a portfolio, the obvious question is how many names are in it. Across 92 facilities with a real lesson program — 200+ lesson hours, $10k+ in attributed lesson revenue, and near-complete trainer tagging — the median facility has 9 trainers who earn lesson revenue, but the money is nowhere near evenly split. The top trainer books 42% of lesson revenue at the median, the top three book 81%, and the whole book spreads across the equivalent of just 3.5 full trainers.
That average hides four genuinely different businesses, so we sorted facilities by how much rides on their top name:
So the answer to “one great trainer or nine even ones?” is: all four shapes are common, and none is a majority. About one facility in five is effectively a one-name lesson program — the top trainer books about 90% of lesson revenue, with only a handful of other names on the board taking scraps. Another fifth is star-led, a third runs a core group of two-to-four real books, and about a quarter has a genuinely deep bench where no one clears 30%.
The interesting part is what happens as lesson businesses grow. Sort these facilities into quartiles by lesson revenue and the bench roughly doubles — from 6 earning trainers in the smallest quarter to 14 in the largest — while the top trainer’s share falls only from 50% to 35%. Meanwhile the top trainer’s own book grows from $9.0k to $42.8k — nearly 5×. Bigger lesson businesses don’t replace the star; they build a bench around a bigger star. Which is exactly why the next section matters.
The dependence ledger
Training businesses concentrate into people: the median facility’s top trainer carries 42% of its lesson revenue — and our facility study already showed the house’s cut of a lesson is about a rental after the split. Sizing that exposure against everything the facility collects: the top trainer’s sessions carry a median 8% of total revenue — modest for the typical, diversified facility — but the tail is where the risk lives: at 31% of facilities the top trainer’s sessions are 15%+ of ALL revenue, and at 15% they’re 25%+. Pair that with the churn line above and with client exclusivity (79% of clients train with one trainer), and the moves write themselves: programs owned by the building, clients exposed to multiple coaches, and a rev-share structure that doesn’t leave you running a landlord business inside your own facility.
With facilities that closed or left excluded from the “ended” column, 68% of regular trainer–facility relationships are still active a year in, and 48% at two years; committed trainers (100+ lifetime hours) hold at 86% and 70%. Read it as a planning clock, not a career obituary — our window is ~2.5 years, spells end for good reasons (school jobs, pro ball, moves), and a trainer who leaves your platform-visible calendar hasn’t necessarily left coaching. But roughly a third of regular relationships turning over within a year is exactly why onboarding, comp clarity, and a bench are infrastructure, not luxuries.
Specialists, hybrids, and the generalist surprise
Roughly three in five classifiable lesson trainers concentrate 80%+ of their classifiable lesson hours in one discipline, a third work two, and ~6% work three or more. Cross-sectionally specialists and hybrids look like twins — same ~$105/hr, similar hours and books. The differences that matter: generalists run ~2× the book (51 vs 23.5 annual clients) by delivering ~2.5× the lesson volume at an identical clients-per-hour rate, and two-discipline (hybrid) trainers out-grew single-discipline trainers by ~18 points of season-adjusted book change this year — a gap that held across every definition we tested (the small three-plus-discipline group did not share it). For a capped specialist, a second discipline is the strongest growth signal in this data: same athlete, same window, more of the development budget.
Part 6: The operator playbook
The through-line: your lesson business is a portfolio of small, seasonal books that swing hard, concentrated in a few people, compressed into 20 weekly hours. Each finding has a corresponding move:
| # | The move | The number behind it |
|---|---|---|
| 1 | Configure comp terms and track payouts in-system — payroll math and margin visibility come free | Only 49% of active trainers have configured terms; a trainer's own realized share runs ~5 points under their configured split, and the pooled median across all comp structures is 47% |
| 2 | Engineer the second booking — rebook in-building, sell first-month packs, default to a standing slot | 26% of new clients never book lesson #2; median trainer keeps 24% past 90 days |
| 3 | Treat the lesson line as a portfolio — a bench of part-time books, not one hero | Continuing books spread -61% to +192.1% in a year (sd 125.1pp) and another 14% go to zero; ~1 in 3 regular trainer relationships ends within 12 months |
| 4 | Audit your dependence ledger — know what % of TOTAL revenue rides on your top trainer, and own the client relationships | Top trainer = 42% of lesson revenue and 8% of TOTAL revenue at the median facility, but 15%+ of total at 31% of facilities; 79% of clients are single-trainer |
| 5 | Cross-train your specialists — add a second discipline before adding a second facility | Two-discipline trainers out-grew specialists by ~18pp; generalists carry ~2× the clients at the same $/hr |
| 6 | Build a summer product — camps, S&C blocks, development programs — before the spring trough hits | Same-trainer hours index: January 122 vs July 56 (2.2×); strength work peaks in summer |
| 7 | Break the 4–8pm cap with group leverage — small-group formats multiply the same prime hour | 62.5% of lesson hours in 20 weekday prime hours; a group hour serves multiples of a private's athletes |
For trainers, the same data is a career map: pick a facility whose programs feed you clients, understand the spectrum before negotiating your split, sell the standing slot rather than the lesson, add a second discipline, and know that a full-time book means ~35 active clients maintained against a 90-day clock — a system, not a following. Baseline runs the system side — scheduling, payouts, packages, and the development proof that keeps clients past day 90. See it live.
Methodology
Data. Aggregated, anonymized operational data from a research cohort of youth sports training businesses on the Baseline platform — figures describe this cohort, not platform totals or the wider market, and the longitudinal analyses are further restricted to facilities with multi-year history: 250,915 trainer-delivered sessions (144,836 private lessons), 232,347 delivered hours, and $9.8M in linked collected payments across 278 facility businesses, July 2025–June 2026 (longitudinal analyses reach back to January 2024). 97.0% of in-window lessons carry a trainer attribution. Test and demo accounts excluded.
- Anonymity. Every published figure aggregates at least 5 distinct businesses; distributions are per-trainer medians and percentiles. Cells with few trainers publish medians or quartiles only (no extreme percentiles), and cells that could characterize an identifiable individual are suppressed.
- Units. A “trainer” is a trainer–facility relationship; 1,400 active relationships correspond to 1,392 distinct people. “Active” = 20+ delivered hours in the window. Multi-trainer sessions split hours evenly; under full attribution the median week is ~3.9 hours instead of 3.3, so published workloads are conservative. Trainer-level client metrics cover lesson-segment trainers only; the client-exclusivity share pools clients across all trainer-tagged lessons.
- Delivered hours. Non-canceled, non-draft calendar sessions with a trainer attached, in the facility’s local time zone. Hours are what the platform can see: off-platform lessons, prep, and facility floor-time aren’t counted, so true working time exceeds delivered time.
- Money. Session revenue links payments to sessions through the platform’s transaction–event links, values credit-pack redemptions at their per-credit price on the session that consumed them, and splits multi-session payments across their sessions. Recorded trainer payouts exclude manual salary-style entries not tied to a collecting transaction (41% of raw recorded payout dollars — leaving them in would overstate lesson-split economics). Modeled earnings apply each trainer’s configured terms to their delivered work — or, for 21 of 582 modeled trainers with tracked payouts but no configured terms, extrapolate from recorded payouts; cross-validation against recorded payouts puts the revenue-share arm of the model ~10% conservative at the median. Earnings are gross training pay, not net income and not household income. The top-trainer share of total revenue joins each facility’s full-category revenue from our facility-economics pipeline over the same window; it is approximate and capped at 100%.
- Clients. A client is a booking identity on a lesson (74% athlete accounts, 25% parent accounts); family duplicates may inflate book sizes by up to ~10% at the median, so client counts are book sizes, not head counts. Relationship lengths use only clients whose first lesson predates the data edge by 180+ days — remaining right-censoring still makes them lower bounds — and exclude one-lesson-ever clients, which are reported separately as the single-lesson share. 90-day retention quotes both the median trainer’s rate (24%) and the pooled client-level rate (31%; 38% in matured cohorts).
- Season, growth, and turnover. Seasonal indexes are same-trainer (each trainer normalized to their own average before pooling). Book-change classes divide each trainer’s half-over-half ratio by the cohort seasonal factor (1.26×) so winter lift doesn’t masquerade as growth. Turnover is facility-conditioned: a trainer–facility relationship only counts as ended when the facility kept running events 60+ days past the trainer’s last session; spells at facilities that went dark are censored (85 of 1405 regular spells), and trainers at facilities that stopped operating mid-window are excluded from book-change shares entirely. Continuation measures platform-visible tenure at one facility over a ~2.5-year observation window — not coaching-career length.
- Limits. One platform’s research cohort, skewed toward youth baseball and softball training businesses in the U.S. Trainers who work entirely off-platform are invisible; facilities that don’t track payouts contribute rate-card and hours data but not realized-split data (payout-tracking facilities skew lesson-heavy). Discipline classification covers 89% of lesson trainers; the specialist/hybrid boundary is definition-sensitive and we quote only findings robust across definitions.
Questions about the data, or want a cut we didn’t publish? Get in touch — we’re happy to run custom aggregates for press and researchers.
Baseline is the all-in-one operating system for sports facilities, clubs, and travel teams — scheduling, payments, programming, and team management in one platform.
Take the full study with you
Download the complete research as a PDF to share with your team.
Keep reading
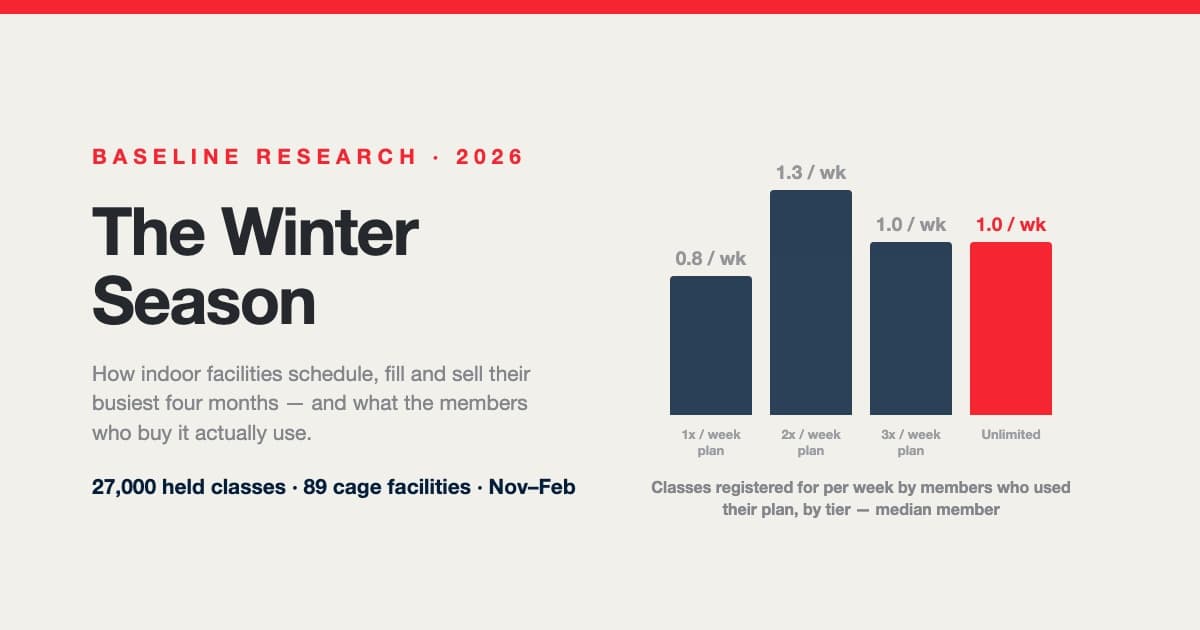
The Winter Season: How Indoor Facilities Schedule, Fill and Sell Their Busiest Four Months
Winter is the season an indoor facility is built for, and every autumn operators rebuild the same schedule from instinct. Across 27,000 held classes at 89 cage-equipped facilities: pitching needs nearly as much room as hitting, the median class has three or four athletes, one hitting program in ten runs every prime hour, classes tie up two-thirds of the cages only at the busiest hour, “unlimited” members come about once a week — and the plan a family buys, not how often they come, decides when they leave.
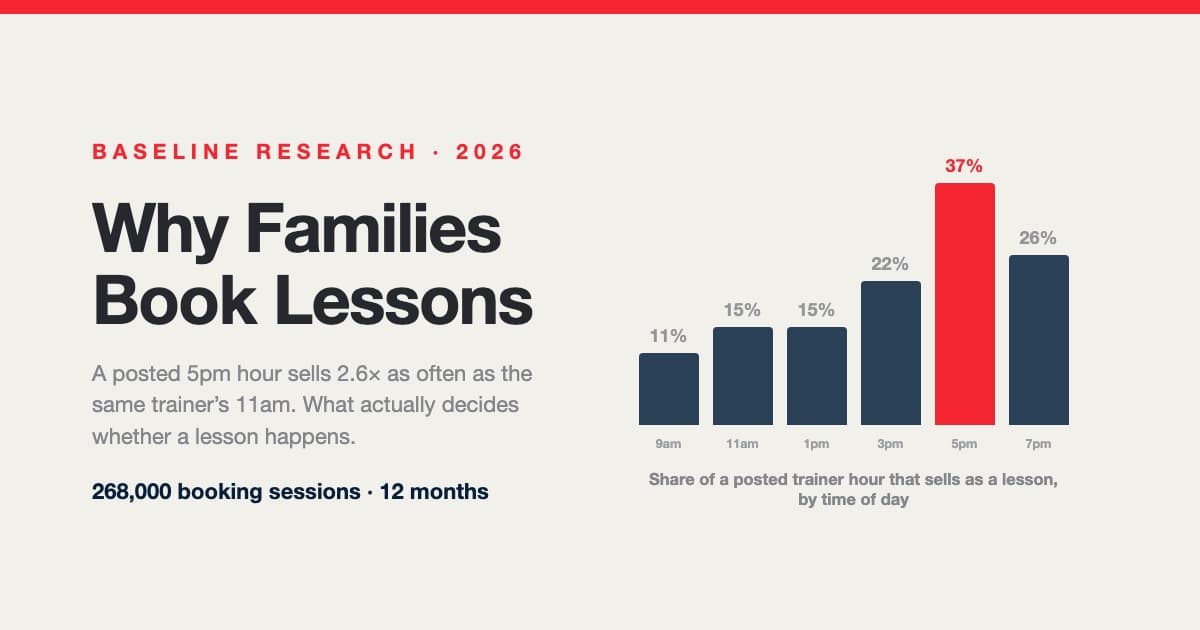
Why Families Book Lessons — and Why They Don't: A Year Inside 268,000 Booking Sessions
A posted 5pm hour sells nearly three times as often as the same trainer's 11am. Across 268,000 booking sessions, 29,812 families and 107,000 posted trainer shifts, what decides whether a lesson happens isn't price, sport or lesson length — it's which hours are on the calendar and how late families go looking. Including a measured answer to the question every operator asks: do 15-minute intervals actually win you bookings?
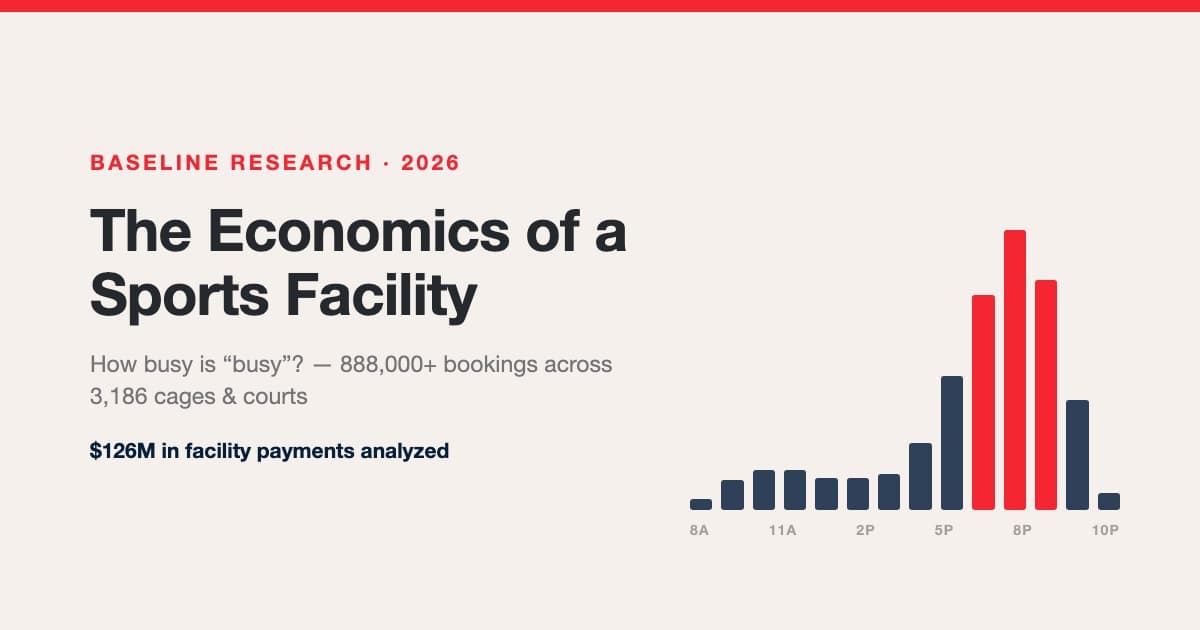
The Economics of a Sports Facility: How Busy Is Busy, What a Space-Hour Is Worth, and How the Packed Facilities Got That Way
We analyzed 888,000+ bookings, 863k space-hours, and $126M in payments across hundreds of sports facilities. Real utilization benchmarks (facilities are spiky, not empty — 2 in 3 sell out prime hours while averaging ~19% occupancy), rentals vs lessons vs group economics, the true lesson margin after trainer splits, credit-pack accounting, seasonality by category, and the occupancy ladder from quiet to packed.